10-K: Annual report [Section 13 and 15(d), not S-K Item 405]
Published on February 19, 2026
UNITED STATES
SECURITIES AND EXCHANGE COMMISSION
Washington, D. C. 20549
FORM
For the fiscal year ended
For the transition period from to
Commission File Number
State of | ||
(State or other jurisdiction of | (I.R.S. Employer | |
incorporation or organization) | Identification No.) |
(Address of registrant’s principal executive office) | (Zip Code) |
Registrant’s telephone number, including area code: (
Securities registered pursuant to Section 12(b) of the Act:
Title of each class | Trading Symbol | Name of each exchange on which registered | ||
Securities registered pursuant to Section 12(g) of the Act: NONE
Indicate by check mark if the registrant is a well-known seasoned issuer, as defined in Rule 405 of the Securities Act. ⌧ NO ◻
Indicate by check mark if the registrant is not required to file reports pursuant to Section 13 or Section 15(d) of the Act. YES ◻ ⌧
Indicate by check mark whether the registrant (1) has filed all reports required to be filed by Section 13 or 15(d) of the Securities Exchange Act of 1934 during the preceding 12 months (or for such shorter period that the registrant was required to file such reports), and (2) has been subject to such filing requirements for the past 90 days. ⌧ NO ◻
Indicate by check mark whether the registrant has submitted electronically every Interactive Data File required to be submitted pursuant to Rule 405 of Regulation S-T during the preceding 12 months. ☒ NO ◻
Indicate by check mark whether the registrant is a large accelerated filer, an accelerated filer, a non-accelerated filer, a smaller reporting company, or an emerging growth company. See the definitions of “large accelerated filer,” “accelerated filer,” “smaller reporting company,” and "emerging growth company" in Rule 12b-2 of the Exchange Act.
Accelerated filer ◻ | Non-accelerated filer ◻ | Smaller reporting company | ||||
Emerging growth company |
If an emerging growth company, indicate by check mark if the registrant has elected not to use the extended transition period for complying with any new or revised financial accounting standards provided pursuant to Section 13(a) of the Exchange Act. ☐
Indicate by check mark whether the registrant has filed a report on and attestation to its management’s assessment of the effectiveness of its internal control over financial reporting under Section 404(b) of the Sarbanes-Oxley Act (15 U.S.C. 7262(b)) by the registered public accounting firm that prepared or issued its audit report.
If securities are registered pursuant to Section 12(b) of the Act, indicate by check mark whether the financial statements of the registrant included in the filing reflect the correction of an error to previously issued financial statements.
Indicate by check mark whether any of those error corrections are restatements that required a recovery analysis of incentive-based compensation received by any of the registrant’s executive officers during the relevant recovery period pursuant to §240.10D-1(b). ◻
Indicate by check mark whether the registrant is a shell company (as defined in Rule 12b-2 of the Act). YES
The aggregate market value of voting stock held by non-affiliates of the registrant was $
Number of shares and rights outstanding as of the latest practicable date.
Class | Outstanding at February 17, 2026 | |
Common Stock, without par value | | |
DOCUMENTS INCORPORATED BY REFERENCE
1. | Proxy statement to be filed with the Commission within 120 days after December 31, 2025, to the extent indicated in Part III. |
Ball Corporation
ANNUAL REPORT ON FORM 10-K
For the year ended December 31, 2025
TABLE OF CONTENTS
Page Number | |||
4 | |||
11 | |||
18 | |||
18 | |||
19 | |||
21 | |||
21 | |||
21 | |||
22 | |||
Management’s Discussion and Analysis of Financial Condition and Results of Operations | 23 | ||
31 | |||
32 | |||
34 | |||
Report of Independent Registered Public Accounting Firm (PCAOB ID | 34 | ||
Consolidated Statements of Earnings for the Years Ended December 31, 2025, 2024 and 2023 | 36 | ||
37 | |||
38 | |||
Consolidated Statements of Cash Flows for the Years Ended December 31, 2025, 2024 and 2023 | 39 | ||
Consolidated Statements of Shareholders’ Equity for the Years Ended December 31, 2025, 2024 and 2023 | 40 | ||
41 | |||
41 | |||
49 | |||
50 | |||
53 | |||
56 | |||
56 | |||
57 | |||
58 | |||
59 | |||
59 | |||
59 | |||
60 | |||
60 | |||
61 | |||
63 | |||
65 | |||
70 | |||
79 | |||
80 | |||
82 | |||
PART I.
Item 1. Business
Ball Corporation and its consolidated subsidiaries (collectively, Ball, the company, we or our) is one of the world’s leading suppliers of aluminum packaging for the beverage, personal care and household products industries. The company was organized in 1880 and incorporated in the state of Indiana, United States of America (U.S.), in 1922. Our sustainable, aluminum packaging products are produced for a variety of end uses and are manufactured in facilities around the world. In 2025, our total consolidated net sales were $13.16 billion.
Our largest product line is aluminum beverage containers and we also produce extruded aluminum aerosol containers, recloseable aluminum bottles across multiple consumer categories and aluminum slugs.
We sell our aluminum packaging products globally to large multinational beverage, personal care and household products companies with which we have developed long-term relationships. This is evidenced by our high customer retention and large number of long-term supply contracts. While we have a diversified customer base, we sell a significant portion of our packaging products to major companies and brands, as well as to numerous regional customers. Our significant customers include top consumer packaging and beverage companies.
We are headquartered in Westminster, Colorado, and our stock is listed for trading on the New York Stock Exchange under the ticker symbol BALL.
Our Strategy
We exist to unlock the infinite potential of aluminum to advance a world free from waste. By leveraging our competitive advantages of bringing our scale to sustainability, the power of our partnerships and the unmatched talent of our people we will win alongside our customers. Our strategy comprises four pillars: executing every day, staying close to our customers, accelerating the substrate shift to aluminum and managing complexity to our advantage. Together, these pillars form a clear framework that enables us to outperform in dynamic markets, serve our customers and create long-term value for those who count on us. How we work is guided by our operating model called the Ball Business System and by our values of We Care. We Work. We Win.
We maintain a clear and disciplined financial strategy focused on executing an efficient operating model to deliver comparable diluted earnings per share growth in excess of 10 percent per annum over the long-term, maximize cash flow, increase Economic Value Added (EVA®) dollars and return value to shareholders.
The cash generated by our businesses is used primarily: (1) to finance the company’s operations, (2) to service the company’s debt, (3) to return value to our shareholders via stock buybacks and dividend payments, and (4) to fund organic or inorganic growth investments. From time to time, we have evaluated and expect to continue to evaluate possible transactions that we believe will benefit the company and our shareholders, which may include strategic acquisitions, divestitures of parts of our company or equity investments. At any time, we may be engaged in discussions or negotiations at various stages of development with respect to one or more possible transactions or may have entered into non-binding letters of intent. As part of any such initiatives, we may participate in processes being run by other companies or leading our own activities. The compensation of many of our employees is tied to the company’s performance through our EVA®-based and other incentive programs.
Sustainability
At Ball Corporation, we deliver circular aluminum packaging solutions and exist to unlock the infinite potential of aluminum to advance a world free from waste.
Our approach to sustainability has evolved over the past 20 years. Today, Ball’s sustainability strategy is driven by high standards around carbon footprint reduction and the circularity of our products. Utilizing strategic partnerships across our value chain, we work to simplify sustainability for our customers by delivering scalable solutions that enable us to win together. This includes aligning our own 2030 Sustainability Goals and strategy to our customers’ climate-related targets, sustainability goals and regulatory requirements.
4
Our vision is to advance sustainability through aluminum packaging. This is exhibited through our commitment to achieve a science-based 55 percent reduction in our greenhouse gas (GHG) footprint by 2030 and net zero carbon emissions prior to 2050. To help reach this target our teams around the world focus on continuously driving operational and supply chain excellence. This drives process optimization, including products designed for optimum metal efficiency, real time monitoring to improve energy efficiency and reuse of water, as well as the reduction of waste and spoilage within our manufacturing plants.
Although, our commitment extends beyond our walls and includes purchasing aluminum from Aluminum Stewardship Initiative (ASI) certified suppliers, sourcing Cradle to Cradle Material Health certified inks and coatings, and reducing value chain emissions, all in order to facilitate the achievement of Ball and its customers’ sustainability targets.
Today’s consumers are increasingly choosing brands based on their sustainability credentials and packaging design regulations are increasing around the world. Aluminum cans are well positioned to meet both trends due to circularity credentials, such as favorable recycling rates and recycled content. In 2023 the global aluminum recycling rate was 75 percent and, as of 2024, Ball beverage cans contained 74 percent recycled content on average. Ball aluminum packaging unlocks the full potential of packaging to help our customers convey their purpose to consumers, while limiting regulatory exposure. We are committed to moving toward a truly circular economy, where materials can be, and actually are, used again and again.
Because recycling aluminum saves resources and uses significantly less energy than primary aluminum production, we are innovating and collaborating with our customers, supply chain, industry groups and other public and private partners to establish and financially support initiatives to increase recycling rates around the world. We work together to create effective collection and recycling systems and educate consumers about the sustainability and circularity benefits of aluminum packaging.
The company’s focus towards sustainability has been recognized by external organizations. Ball earned a MSCI AAA ESG rating, received a Gold Medal in recognition of overall sustainability achievements through EcoVadis and has been listed on the North American Dow Jones Sustainability Index for 6 years in a row.
Human Capital and Employees
Ball Corporation’s people are its greatest asset and we are proud to outline the material aspects of our human capital program. At the end of 2025, the company and its subsidiaries employed approximately 16,000 employees, including approximately 5,000 employees in the U.S. Details of collective bargaining agreements are included within Item 1A, Risk Factors of this annual report.
Our Culture
Embracing our rich 146-year history, we are a company that respects each of our employees and are guided and motivated by our values of We Care. We Work. We Win. Purposefully at the center of the Ball Business System is our people and culture – the heartbeat of our organization. We are driving a culture where everyone has the opportunity to contribute to our shared success, realize their leadership potential and grow as individuals. Our nine Ball Global Networks provide employees with opportunities to celebrate each other’s differences, create safe and accommodating work environments and inspire one another. Our Ball spirit is also evident outside of our walls through the ways we support the communities where we live and work with employees donating more than 24,000 hours to charitable causes last year. We are committed to a safe and fulfilling work environment where our Ball team members demonstrate hard work and teamwork, with low egos and high collaboration. We lead with integrity and are inspired to make a difference for our customers, communities and company.
Belonging, Inclusion & Diversity
At Ball, fostering a workplace where employees are supported and able to contribute effectively is an important part of our business. Since 2015, we have maintained a focused approach to inclusion, recognizing the role that a broad range of perspectives can play in supporting innovation, collaboration, and business outcomes. In recent years, this focus has expanded to include Belonging, reflecting our efforts to support an environment where employees feel respected and engaged.
5
In 2025, we expanded the reach of the Global Inclusion Council establishing Regional Inclusion Committees to support local engagement and implementation of BI&D (“Belonging, Inclusion and Diversity”) initiatives across our global operations. Leaders across our business segments remain responsible for fostering inclusive workplace practices and maintaining a highly qualified workforce. We also conducted a Workplace Inclusion Scan across our global plants and facilities to assess accessibility and inclusivity. The results of this assessment are being used to help identify opportunities for improvement and to inform future actions related to workplace accessibility and employee experience.
Our approach to BI&D is integrated into our broader talent and business strategy. We prioritize fostering an inclusive culture, ensuring equitable access to opportunities, and supporting a workplace that reflects the diverse perspectives of the communities where we operate.
Talent
Attracting, developing and retaining top talent is essential to our success. Our talent management organization has dedicated acquisition and development functions, with standard hiring processes, assessments, and investment in development planning to align with our cultural values and strategic goals.
Embedded in our approach is the “Inspire, Connect, Achieve” leadership framework, which defines clear behaviors for people leaders to drive performance and cultural alignment. We continue to strengthen our succession planning through a disciplined, enterprise-wide approach that integrates targeted development experiences and formal development planning to build a robust pipeline of future leaders.
These efforts ensure we maintain a high-performing, engaged workforce ready to achieve our long-term objectives.
Training and Development
We are committed to fostering a culture of continuous learning and development, equipping our employees with the skills and resources needed to thrive in a rapidly evolving business environment. To complement this, our performance enablement approach prioritizes employee growth and continuous improvement. The performance enablement methodology encourages regular, meaningful performance conversations between managers and employees, while actively mitigating bias and fostering a fair and enriching developmental experience. These efforts enhance the data available for talent discussions and decision-making.
We believe that investing in our employees’ growth is essential to driving both individual and organizational success, which is why we provide comprehensive resources to support learning and development at all levels:
| ● | Ball Academy Platform: A seamless and unified learning experience designed to help employees thrive, grow and achieve their fullest potential. |
| ● | Leadership Development Programs: Tailored programs for leaders at all levels that blend theoretical knowledge with practical application. |
| ● | LinkedIn Learning Access: Available to all employees for self-paced learning and skill enhancement. |
| ● | Professional Coaching: Personalized development opportunities through a partnership with a global coaching firm. |
| ● | Educational Support: Tuition reimbursement and instructional programs for continuous learning. |
| ● | Leadership Communications: Monthly newsletters for leaders addressing timely topics such as team wellbeing, managing change, setting goals, improving team performance, fostering belonging and inclusion and sharing effective leadership practices. |
| ● | Compliance Training: Annual training on compliance, antitrust, bribery, corruption and our business code of conduct for key management, sales and supply chain personnel. |
These initiatives reflect our commitment to investing in our employees’ development, enhancing their skills and cultivating a culture of continuous learning and growth.
6
Employee Engagement
In 2025, Ball Corporation faced a year of transformation, with senior leadership changes and further adoption of the operating model and brand identity. Amid changes, the company prioritized keeping employees informed and engaged, underscoring its commitment to fostering trust and unity across the organization.
An employee engagement survey conducted in September 2025 demonstrated the resilience of Ball's workforce. With an impressive global response rate of 87 percent, the survey revealed strong alignment with the company’s vision and values. Employees expressed pride in being part of Ball and confidence in its future. Engagement levels remained robust, with scores exceeding or meeting industry norms in key areas, including overall engagement and inclusion and belonging.
Insights from the employee engagement survey are guiding Ball's efforts to develop action plans that address employee feedback and build on the company’s strengths. As Ball looks to 2026, the focus remains on driving higher engagement and advancing team effectiveness to sustain a culture of collaboration and innovation.
Total Rewards
Our global total rewards philosophy enables business performance by offering comprehensive total rewards that attract, retain and motivate our employees and promote their overall wellbeing. In addition, our competitive pay positioning strategy allows employees to share in business success and be rewarded through a variety of compensation opportunities reflective of their individual potential and contributions. Base pay is positioned in a competitive range of the applicable market median in each jurisdiction, differentiated based on skills, knowledge and experience, and designed to attract and retain the best talent. Beginning in 2025, we introduced a common enterprise-wide approach for enabling individual performance and delivering competitive incentive rewards, which are key to advancing our business and strengthening our One Ball winning culture. Our short-term incentive plan for salaried employees will reward individual performance as well as company performance, thereby encouraging a high-performing culture. Long-term incentives for our most senior employees aid retention and provide a longer-term focus on key business metrics. We also have programs which provide additional opportunity for, and retention of, our employees who show the highest potential to develop into future leaders.
Health, Safety and Wellbeing
The health, safety and wellbeing of all employees is a top priority at Ball. Our environmental, health and safety function and our operations executives partner to consistently reinforce policies and procedures that are designed to reduce workplace risks and ensure safe methods of plant production, including through regular training and reporting on injuries and lost-time incidents. 2025 marked another year of strong progress in Ball’s global safety performance. Through the active engagement of employees worldwide, we achieved a 19 percent reduction in our total recordable incident rate (“TRIR”), lowering it to 0.98 and surpassing our 2030 target.
We sponsor a variety of health and wellbeing programs designed to support all aspects of our employees’ wellbeing, including their physical, emotional, social and financial health. In addition, the Employee Assistance Program provides employees and their families access to mental health, stress management and other support resources essential to navigating life changes and challenges.
Additional information on our human capital programs can be found in the Ball Corporation Combined Annual and Sustainability Report, which is available at www.ball.com/sustainability.
Our Reportable Segments
On February 16, 2024, the company completed the divestiture of its aerospace business. The transaction represents a strategic shift; therefore, the company’s consolidated financial statements reflect the aerospace business’ financial results as discontinued operations for all periods presented. The aerospace business was historically presented as a reportable segment. Effective as of the first quarter of 2024, the company reports its financial performance in the three reportable segments outlined below: (1) beverage packaging, North and Central America; (2) beverage packaging, Europe, Middle East and Africa (beverage packaging, EMEA) and (3) beverage packaging, South America. Ball also has investments in the U.S., Guatemala, Panama, Vietnam and Saudi Arabia that are accounted for using the equity method of accounting
7
and, accordingly, those results are not included in segment sales or earnings. Additional financial information related to each of our segments is included in Item 7 Management’s Discussion and Analysis of Financial Condition and Results of Operations, and in Note 3 to the consolidated financial statements within Item 8 of this Annual Report on Form 10-K (annual report).
Beverage Packaging, North and Central America, Segment
Beverage packaging, North and Central America, is Ball’s largest segment, accounting for 48 percent of consolidated net sales in 2025. Aluminum beverage containers are primarily sold under multi-year supply contracts to fillers of carbonated soft drinks, beer, energy drinks and other beverages.
Aluminum beverage containers and ends are produced at 17 manufacturing facilities in the U.S., one in Canada and two in Mexico. The beverage packaging, North and Central America, segment also includes interests in three investments that are accounted for using the equity method. In the first quarter of 2025, Ball acquired Florida Can Manufacturing, which consisted of one manufacturing facility in Winter Haven, Florida, see Note 4 for details.
According to publicly available information and company estimates, the North American aluminum beverage container industry represents approximately 139 billion units. Five companies manufacture substantially all of the aluminum beverage containers in the U.S., Canada and Mexico. Ball, the largest producer in the region, shipped approximately 50 billion aluminum beverage containers in North and Central America in 2025, which represented approximately 36 percent of the aggregate shipments in these countries. Historically, sales volumes of metal beverage containers in North America tend to be highest during the period from April through September. All of the beverage containers produced by Ball in the U.S., Canada and Mexico are made of aluminum. In North and Central America, a diverse base of more than seven global suppliers provide almost all of our aluminum can and end sheet requirements.
Beverage containers are sold based on price, quality, service, innovation and sustainability in a highly competitive market, which is relatively capital intensive and characterized by facilities that run more or less continuously in order to operate profitably. In addition, the aluminum beverage container competes with other packaging materials which include meaningful industry positions by the glass bottle in the packaged beer industry and the polyethylene terephthalate (PET) bottle in the carbonated soft drink and water industries.
We limit our exposure to changes in the cost of aluminum as a result of the inclusion of provisions in most of our aluminum beverage container sales contracts to pass-through aluminum price changes, as well as through the use of derivative instruments.
Beverage Packaging, EMEA, Segment
The beverage packaging, EMEA, segment accounted for 30 percent of Ball’s consolidated net sales in 2025. Our EMEA region operations include 19 facilities throughout Europe and one facility each in Cairo, Egypt, and Manisa, Turkey. For the countries in which we currently operate, the aluminum beverage container market is approximately 97 billion containers, and we are the largest producer with an estimated 39 percent of shipments in this region. The markets served by our beverage packaging, EMEA, segment, including Egypt and Turkey, are highly regional in terms of sales growth rates and packaging mix. Four companies manufacture substantially all of the metal beverage containers in EMEA. Our EMEA beverage facilities, shipped 38 billion aluminum beverage containers in 2025.
Historically, sales volumes of metal beverage containers in EMEA tend to be highest during the period from May through August, with a smaller increase in demand leading up to the winter holiday season in the U.K. Much like in other parts of the world, the aluminum beverage container competes with other packaging materials used by the beer and soft drink industries. The glass bottle is heavily utilized in the packaged beer industry, while the PET container is utilized in the carbonated soft drink, beer, juice and water industries. These trends are evolving, however, as customers, regulators and non-governmental organizations continue to press for more sustainable packaging.
Raw material supply contracts in this region generally have longer term agreements. Six global aluminum suppliers provide almost all of our aluminum can and end sheet requirements. The company minimizes its exchange rate risk using derivative and supply contracts in local currencies. We limit our exposure to changes in the cost of aluminum as a result of the inclusion of provisions in most of our aluminum beverage container sales contracts to pass-through aluminum price changes, as well as through the use of derivative instruments.
8
Beverage Packaging, South America, Segment
The beverage packaging, South America, segment accounted for 16 percent of Ball’s consolidated net sales in 2025. Our operations consist of 12 facilities—9 in Brazil and one each in Argentina, Chile and Paraguay. For the countries where we operate, the South American aluminum beverage container market is approximately 43 billion containers, and we are the largest producer in this region with an estimated 46 percent of South American shipments in 2025. Four companies currently manufacture substantially all of the aluminum beverage containers in the regions served by our beverage packaging, South America, segment. The company’s South American beverage facilities shipped approximately 20 billion aluminum beverage containers in 2025.
Historically, sales volumes of beverage containers in South America tend to be highest during the period from September through December. In South America, two global suppliers provide virtually all our aluminum can and end sheet requirements with certain requirements also being imported from Asia. The aluminum beverage container competes with other packaging materials which include meaningful industry positions by the glass bottle in the packaged beer industry and the polyethylene terephthalate (PET) bottle in the carbonated soft drink and water industries.
We limit our exposure to changes in the cost of aluminum as a result of the inclusion of provisions in most of our aluminum beverage container sales contracts to pass-through aluminum price changes, as well as through the use of derivative instruments.
Other
Other consists of a non-reportable operating segment (beverage packaging, other) that manufactures and sells aluminum beverage containers in India and Myanmar; a non-reportable operating segment that manufactures and sells extruded aluminum aerosol containers and recloseable aluminum bottles across multiple consumer categories as well as aluminum slugs (personal & home care, formerly aerosol packaging) throughout North America, South America, Europe, and Asia; undistributed corporate expenses; and intercompany eliminations and other business activities.
Beverage Packaging, Other
Our aluminum beverage packaging operations in the beverage packaging, other, segment consist of three facilities – two in India and one in Myanmar. Our aluminum can and end sheet requirements are provided by several suppliers.
On August 27, 2025, the company sold 41 percent of its 51 percent ownership interest in Ball United Arab Can Manufacturing Company, which resulted in Ball deconsolidating the business and retaining a 10 percent ownership interest. The financial results of the Saudi Arabian business, which were a part of the beverage packaging, other, non-reportable operating segment, are presented in Other in the tables below through the date of the transaction and as of December 31, 2024, the assets and liabilities of the Saudi Arabian business were presented as current assets held for sale and current liabilities held for sale on the consolidated balance sheet. See Note 4 for further details.
Additionally, Ball has ownership interests in an equity method investment in Vietnam.
Personal & Home Care
Our personal & home care (PHC) operations manufacture and sell extruded aluminum aerosol containers, recloseable aluminum bottles across multiple consumer categories, and aluminum slugs, which represented less than 5 percent of Ball’s consolidated net sales in 2025. There are 9 manufacturing facilities that manufacture these products – six in Europe and one each in Canada, Brazil and Mexico. Included within the PHC facility count are facilities in Lummen, Belgium and Llinars del Vallés, Spain that the company acquired in late-October 2024 through the acquisition of the entire share capital of Alucan Entec, S.A. See Note 4 for further details regarding this acquisition. The PHC market in which we operate shipped approximately 6.8 billion units in 2025 and we are one of the major producers in this market with shipments of 1.5 billion aluminum PHC containers, representing approximately 21 percent of total shipments in the market. Our aluminum PHC requirements are provided by several suppliers.
9
Aluminum Cups
On March 21, 2025, Ball closed on a transaction for its aluminum cups business, which resulted in Ball deconsolidating the business. The financial results of the aluminum cups business are presented in Other in the tables below through the date of the transaction and the assets and liabilities of the business were presented as current assets held for sale and current liabilities held for sale on the consolidated balance sheet as of December 31, 2024. See Note 4 for further details.
Patents
In the opinion of the company’s management, none of our active patents or groups of patents is material to the successful operation of our business as a whole. We manage our intellectual property portfolio to obtain the durations necessary to achieve our business objectives.
Research and Development
Research and development (R&D) efforts are primarily directed toward packaging innovation, specifically the development of new features, sizes, shapes and types of containers, as well as new uses for existing containers. Other R&D efforts seek to improve manufacturing efficiencies and the overall sustainability of our products. Our R&D activities are primarily conducted in a technical center located in Westminster, Colorado.
Where to Find More Information
Ball Corporation is subject to the reporting and other information requirements of the Securities Exchange Act of 1934, as amended (Exchange Act). Reports and other information filed with the Securities and Exchange Commission (SEC) pursuant to the Exchange Act may be inspected and copied at the public reference facility maintained by the SEC in Washington, D.C. The SEC maintains a website at www.sec.gov containing our reports, proxy materials and other items. The company also maintains a website at www.ball.com/investors on which it provides a link to access Ball’s SEC reports free of charge, under the link “Financial Results.”
The company has established written Ball Corporation Corporate Governance Guidelines; a Ball Corporation Executive Officers and Board of Directors Business Ethics Statement; a Business Ethics Code of Conduct; and charters for its Audit Committee, Nominating/Corporate Governance Committee, Human Resources Committee and Finance Committee. These documents are available on the company’s website at www.ball.com/investors, under the link “Governance.” A copy may also be obtained upon request from the company’s corporate secretary. The company’s Combined Annual and Sustainability Report is available at www.ball.com/sustainability.
The company will post on its website the nature of any amendments to the company’s codes of ethics that apply to executive officers and directors, including the chief executive officer, chief financial officer and controller, and the nature of any waiver or implied waiver from any code of ethics granted by the company to any executive officer or director. These postings will appear on the company’s website at www.ball.com/investors, under the link “Governance.”
Nothing on our website, including postings to the “Governance” and “Financial Results” pages, or the Ball Corporation Combined Annual and Sustainability Report, or sections thereof, shall be deemed incorporated by reference into this annual report.
10
Item 1A. Risk Factors
Any of the following risks could materially and adversely affect our business, results of operations, cash flows and financial condition.
General Risks
If we do not effectively manage change and growth, our business could be adversely affected.
Our future revenue and operating results will depend on our ability to effectively manage the anticipated growth of our business. We have experienced fluctuations in the growth in demand for our products and services in recent years and are rebalancing our operations, managing our headcount, and developing new and innovative product offerings to balance our supply positions with our customers’ requirements in each region. These circumstances have placed significant demands on our management as well as our financial and operational resources, and present several challenges, including:
| ● | rebalancing manufacturing capacity, maintaining quality and optimizing production; |
| ● | identifying, attracting and retaining qualified personnel; |
| ● | developing and retaining our global sales, marketing and administrative infrastructure and capabilities; |
| ● | increasing our regulatory compliance capabilities, particularly in new lines of business; |
| ● | addressing climate related risks and opportunities; |
| ● | optimizing our expertise in a number of disciplines, including marketing, licensing, and merchandising; and |
| ● | implementing appropriate operational, financial and IT systems and internal controls. |
Our business, operating results and financial condition are subject to particular risks in certain regions of the world.
We may experience an operating loss in one or more regions of the world for one or more periods, which could have a material adverse effect on our business, operating results or financial condition. Moreover, overcapacity, which often leads to lower prices, may develop over time in certain regions in which we operate even if demand continues to grow. More generally, supply and demand fluctuations could make it difficult for us to forecast and meet certain customers’ needs. Our ability to manage such operational fluctuations and to maintain adequate long-term strategies in the face of such developments will be critical to our continued growth and profitability.
The loss of a key customer, or an adverse change in its requirements, could have a significant negative impact on our sales.
We sell a majority of our packaging products to a relatively limited number of major beverage, personal care and household product companies, some of which operate in multiple geographical markets we serve.
Although the majority of our customer contracts are long-term, these contracts, unless they are renewed, expire in accordance with their respective terms and are terminable under certain circumstances, such as our failure to meet quality, volume or market pricing requirements. Because we depend on a relatively limited number of major customers, our business, financial condition or results of operations could be adversely affected by the loss of any of these customers, a reduction in the purchasing levels of these customers, a strike or work stoppage by a significant number of these customers’ employees or an adverse change in the terms of the supply agreements with these customers.
11
We have a significant level of debt that could have important consequences for our business and any investment in our securities.
The company had $7.01 billion of debt at December 31, 2025. Such indebtedness could have significant consequences for our business and any investment in our securities, including:
| ● | increasing our vulnerability to adverse economic, industry or competitive developments; |
| ● | requiring more of our cash flows from operations to be dedicated to the payment of principal and interest on our indebtedness, thus limiting our cash flow available to fund our operations, capital expenditures and future business opportunities or the return of cash to our shareholders; |
| ● | restricting us from making additional acquisitions; |
| ● | limiting our ability to obtain additional financing for working capital, capital expenditures, product development, debt service requirements, acquisitions and general corporate or other purposes; and |
| ● | limiting our flexibility in planning for, or reacting to, changes in our business or market conditions and placing us at a competitive disadvantage compared to our competitors who may be less leveraged and who, therefore, may be able to take advantage of opportunities that our leverage prevents us from exploiting. |
We face competitive risks from many sources that may negatively impact our profitability.
Competition within the packaging industry is intense. Increases in productivity, combined with potential surplus capacity, have maintained competitive pricing pressures. The principal methods of competition in the general packaging industry are price, innovation, sustainability, service and quality. Some of our competitors may have greater financial, technical and marketing resources, and some may currently have excess capacity. Our current or potential competitors may offer products at a lower price or products that are deemed superior to ours. The global economic environment has resulted in reductions in demand for our products in some instances, which, in turn, could increase these competitive pressures.
We are subject to competition from alternative products, which could result in lower profits and reduced cash flows.
Our aluminum packaging products are subject to significant competition from substitute products, particularly plastic carbonated soft drink bottles made from PET, single serve and returnable beer bottles and other beverage containers made of glass, cardboard or other materials. Competition from plastic carbonated soft drink bottles is particularly intense in the U.S. and Europe, and there is competition from glass beer bottles in Brazil. There can be no assurance that our products will successfully compete against alternative products, which could result in a reduction in our profits or cash flows.
Our packaging businesses have a narrow product range, and our business would suffer if usage of our products decreased or if decreases occur in the demand for the beverages and other goods filled in our products.
The majority of our consolidated net sales were from the sale of beverage containers, and we expect to derive a significant portion of our future revenues and cash flows from the sale of beverage containers. Our business would suffer if the use of beverage containers decreased. Accordingly, broad acceptance by consumers of aluminum containers for a wide variety of beverages is critical to our future success. If demand for glass and PET bottles increases relative to aluminum containers, or the demand for aluminum containers does not develop as expected, our business, results of operations, cash flows and financial condition could be materially adversely affected.
12
Our business, financial condition, cash flows and results of operations are subject to risks resulting from broader geographic operations.
We derived approximately 53 percent of our consolidated net sales from outside of the U.S. for the year ended December 31, 2025. The sizeable scope of operations inside and outside of the U.S. may lead to more volatile financial results and make it more difficult for us to manage our business. Reasons for this include, but are not limited to, the following:
| ● | political and economic instability; |
| ● | the continuation or escalation of global conflicts; |
| ● | governments’ restrictive trade policies; |
| ● | the imposition or rescission of duties, tariffs, taxes or government royalties; |
| ● | exchange rate risks; |
| ● | inflation of direct input costs; |
| ● | virus and disease outbreaks and responses thereto; and |
| ● | difficulties in enforcement of contractual obligations and intellectual property rights. |
We are exposed to exchange rate fluctuations.
The company’s financial results are exposed to currency exchange rate fluctuations and a significant proportion of assets, liabilities and earnings are denominated in non-U.S. dollar currencies. The company presents its financial statements in U.S. dollars and has a significant proportion of its net assets, debt and income in non-U.S. dollar currencies, primarily the euro, as well as the currencies of Argentina, Egypt, Turkey and other emerging markets. The company’s financial results and capital ratios are therefore sensitive to movements in currency exchange rates.
We manage our exposure to currency fluctuations, particularly our exposure to fluctuations in the euro to U.S. dollar exchange rate to attempt to mitigate the effect of cash flow and earnings volatility associated with exchange rate changes. We primarily use derivative instruments to manage our currency exposures and, as a result, we experience gains and losses on these derivative positions, which are offset by the impact of currency fluctuations on existing assets and liabilities.
We are vulnerable to fluctuations and disruptions in the supply and price of raw materials, including increases in tariffs on imported goods.
We purchase aluminum and other raw materials and packaging supplies, including dunnage, from several sources. While all such materials and supplies are available from independent suppliers, they are subject to fluctuations in price and availability attributable to a number of factors, including general economic conditions, commodity price fluctuations (particularly aluminum on the London Metal Exchange), the demand by other industries for the same raw materials and the availability of complementary and substitute materials. Although we enter into commodities purchase agreements from time to time and sometimes use derivative instruments to seek to manage our risk, we cannot ensure that our current suppliers of raw materials will be able to supply us with sufficient quantities at reasonable prices. Economic, financial, and operational factors, including strikes or labor shortages, as well as governmental action, could impact our suppliers, thereby causing supply shortages. Increases in raw material costs, including potential increases due to tariffs, sanctions, or other trade actions, could have a material adverse effect on our business, financial condition or results of operations. For example, in September 2025, we received notice from the U.S. Customs and Border Protection challenging the tariff classification and applicable rate of duty of certain aluminum imports asserting additional duties and tariffs are payable, as well our use of certain exemptions. We intend to vigorously defend the matter. While the outcome of this matter is uncertain at this time, the company believes it is reasonably possible any such additional tariffs, interest and penalties could be owed and impact our results of operations. The company is unable to develop a reasonable estimate of loss at this time. The company has not recorded a reserve. Global supply chain disruptions can negatively impact our results. In the Americas, Europe and Asia, some contracts do not allow us to pass along increased raw material costs and we generally use derivative agreements to seek to manage this risk. Our hedging procedures may be insufficient and our results could be materially impacted if costs of materials increase. Due to the fixed-price contracts, increased prices could decrease our sales volume over time. The delayed timing in recovering the pass-through of increasing raw material costs may also impact our short-term profitability and certain costs due to price increases or supply chain inefficiencies may be unrecoverable, which would also impact our profitability.
13
Net earnings and net assets could be materially affected by an impairment of goodwill.
We have a significant amount of goodwill recorded on our consolidated balance sheet as of December 31, 2025. We are required at least annually to test the recoverability of goodwill. If general market conditions deteriorate in portions of our business, we could experience a significant decline in the fair value of our reporting units. This decline could lead to an impairment of all or a significant portion of the goodwill balance, which could materially affect our U.S. GAAP net earnings and net assets.
If the investments in Ball’s pension plans, or in the multi-employer pension plans in which Ball participates, do not perform as expected, we may have to contribute additional amounts to the plans, which would otherwise be available for other general corporate purposes.
Ball maintains defined benefit pension plans covering a significant portion of its current and former employees in the United States, which are funded based on certain actuarial assumptions. The plans’ assets consist primarily of common stocks, fixed-income securities and alternative investments. Market declines, longevity increases or legislative changes, such as the Pension Protection Act in the U.S., could result in a prospective decrease in our available cash flow and net earnings over time, and the recognition of an increase in our pension obligations could result in a reduction to our shareholders’ equity. Additional risks exist related to the company’s participation in multi-employer pension plans. Assets contributed to a multi-employer pension plan by one employer may be used to provide benefits to employees of other participating employers. If a participating employer in a multi-employer pension plan stops contributing to the plan, the unfunded obligations of the plan may be borne by the remaining participants. This could result in increases to our contributions to the plans as well as pension expense.
Restricted access to capital markets could adversely affect our short-term liquidity and prevent us from fulfilling our obligations under the notes issued pursuant to our bond indentures.
A reduction in global market liquidity could:
| ● | restrict our ability to fund working capital, capital expenditures and other business activities; |
| ● | increase our vulnerability to general adverse economic and industry conditions, including the credit risks stemming from the economic environment; |
| ● | limit our flexibility in planning for, or reacting to, changes in our businesses and the industries in which we operate; |
| ● | restrict us from making strategic acquisitions or exploiting business opportunities; and |
| ● | limit, along with the financial and other restrictive covenants in our debt, among other things, our ability to borrow additional funds, dispose of assets, pay cash dividends or refinance debt maturities. |
If market interest rates increase, our variable-rate debt and any need to refinance debt will create higher debt service requirements, which adversely affects our cash flows. While we sometimes enter into agreements limiting our exposure, any such agreements may not offer complete protection from this risk.
The global credit, financial and economic environment could have a negative impact on our results of operations, financial position or cash flows.
The overall credit, financial and economic environment could have significant negative effects on our operations, including:
| ● | the creditworthiness of customers, suppliers and counterparties could deteriorate resulting in a financial loss or a disruption in our supply of raw materials; |
| ● | volatile market performance could affect the fair value of our pension assets, potentially requiring us to make significant additional contributions to our defined benefit pension plans to maintain prescribed funding levels; |
| ● | a significant weakening of our financial position or operating results could result in noncompliance with our debt covenants; and |
| ● | reduced cash flows from our operations could adversely affect our ability to execute our long-term strategy to repurchase our stock and invest in our businesses. |
14
Changes in U.S. generally accepted accounting principles (U.S. GAAP) and SEC rules and regulations could materially impact our reported results.
U.S. GAAP and SEC accounting and reporting changes are common. These changes could have significant effects on our reported results when compared to prior periods and other companies and may even require us to retrospectively adjust prior periods. Additionally, material changes to the presentation of transactions in the consolidated financial statements could impact key ratios that investors, analysts and credit rating agencies use to assess or rate Ball’s performance and could ultimately impact our ability to access the credit markets in an efficient manner.
A material weakness in our internal control over financial reporting could, if not remediated, result in material misstatements in our financial statements.
Management is responsible for establishing and maintaining adequate internal control over financial reporting, as defined in Rule 13a-15(f) under the Securities Exchange Act. A material weakness is defined as a deficiency, or combination of deficiencies, in internal control over financial reporting, such that there is a reasonable possibility that a material misstatement of annual or interim financial statements will not be prevented or detected on a timely basis. If a material weakness is identified, management could conclude that internal control over financial reporting is not effective based on criteria set forth by the Committee of Sponsoring Organization of the Treadway Commission in “Internal Control—An Integrated Framework (2013).” If a material weakness is identified, a remediation plan would be designed to address the material weakness. If remedial measures are insufficient to address the material weakness, or if additional material weaknesses in internal control are discovered or occur in the future, our consolidated financial statements may contain material misstatements and we could be required to restate our financial results. As of December 31, 2025, the company had no material weaknesses.
We face risks related to health epidemics, pandemics and other outbreaks, which could adversely affect our business.
Health epidemics, pandemics and other outbreaks could give rise to circumstances that cause one or more of the following risk factors to occur:
| ● | We could lose key customers, customers could become insolvent or have a reduction in demand for our products and services; |
| ● | We could be subject to changes in laws and governmental regulations that adversely affect our business and operations; |
| ● | We could be subject to adverse fluctuations in currency exchange rates; |
| ● | We might lose key management and operating personnel; |
| ● | We may be subject to disruptions in the supply or price of our raw materials; |
| ● | We may face prolonged work stoppages at our facilities; |
| ● | Our pension plan investments may not perform as expected, and we may be required to make additional contributions to our pension plans which would otherwise be available for other general corporate purposes; |
| ● | Our access to capital markets may be restricted, which could adversely affect our short-term liquidity and prevent us from fulfilling our obligations under the notes issued pursuant to our bond indentures; |
| ● | We may be subject to increased information technology (IT) security threats and reduced network access availability; |
| ● | Our operations and those of our principal customers and suppliers could be designated as non-essential in key markets; and |
| ● | A material weakness in our internal control over financial reporting or a material misstatement in our financial statements could occur. |
15
Investment Risks
Our investments in acquisitions, joint ventures and new developments may include risks that could have an adverse impact on our business.
We make investments in the growth of our business through the development of new facilities, the improvement of existing facilities, the acquisition of assets or securities of other businesses and through joint venture arrangements. The realization of the expected benefits of these investments is based in part on our ability to cost effectively execute our development plans and, in certain instances, to integrate these investments with our business operations. If we fail to execute our development plans in a cost effective or timely manner or fail to integrate the investments with our existing operations, our internal controls over financial reporting or our information systems, we may experience increases in costs of operations, loss of customers or suppliers, difficulties servicing our debt obligations and our financial performance may not meet shareholder expectations. In addition, our final estimates of the fair value of any assets or liabilities acquired with the investments may be materially different from our initial estimates and the company may not fully realize the anticipated benefits of the investments.
Our investments in joint ventures include investments in companies that we may not control. The performance of these investments may change as a result of decisions that are made by our joint venture partners who have control over these joint ventures. In addition, we may be obligated under the joint venture arrangement to assume certain costs, perform certain services or make additional capital investments. If we are unable to realize the benefits of our joint venture and other investments, our business, our operating results and the financial condition of our business could be materially adversely affected.
Governmental and regulatory risks
Changes in laws and governmental regulations may adversely affect our business and operations.
We and our customers and suppliers are subject to various federal, state, provincial and local laws and regulations, which have been increasing in number and complexity. Each of our, and their, facilities is subject to federal, state, provincial and local licensing and regulation by health, environmental, workplace safety and other agencies in multiple jurisdictions. Requirements and restrictions of worldwide governmental authorities with respect to manufacturing, manufacturing facility locations within the jurisdiction, product content and safety, climate change, workplace safety and health, environmental, expropriation of assets and other standards could adversely affect our ability to manufacture or sell our products, and the ability of our customers and suppliers to manufacture and sell their products. Federal, state and local regulations imposing taxes and restrictions on our customers products could adversely impact the purchasing levels by our customers. In addition, we face risks arising from compliance with and enforcement of numerous and complex federal, state, provincial and local laws and regulations.
While deposit systems and other container-related legislation have been adopted in some jurisdictions, similar legislation has been defeated in public referenda and legislative bodies in many others. We anticipate that continuing efforts will be made to consider and adopt such legislation in the future. The packages we produce are widely used and perform well in U.S. states, Canadian provinces and European countries that have deposit systems, as well as in other countries worldwide.
Environmental, social and governance reporting requirements and other legislation and regulatory requirements exist and are also evolving. The compliance costs associated with current and proposed laws and potential regulations could be substantial, and any failure or alleged failure to comply with these laws or regulations could lead to litigation, governmental action or reputational damage, all of which could adversely affect our financial condition or results of operations.
Our business faces the potential of increased regulation on some of the raw materials utilized in our packaging operations.
Our operations are subject to federal, state, provincial and local laws and regulations in multiple jurisdictions relating to some of the raw materials utilized in our container making process. Various U.S. states have passed or are contemplating legislation restricting, and the EU is reviewing a proposal to restrict, the use of materials that contain intentionally added per- and polyfluoroalkyl substances (PFAS), which may require the company to continue to incur costs to convert
16
existing coatings to accommodate PFAS-free coatings. To mitigate these risks, the company is working with its suppliers to require them to remove PFAS-containing coatings from our products.
Earnings and cash flows can be impacted by changes in tax laws.
As a U.S.-based multinational business, the company is subject to income tax in the U.S. and numerous jurisdictions outside the U.S., as well as recent OECD, European Commission and other trans-national initiatives that seek to impose minimum tax thresholds on most multi-national companies. The relevant tax rules and regulations are complex, often changing and, in some cases, are interdependent. If these or other tax rules and regulations should change, the company’s earnings and cash flows could be impacted.
The company’s worldwide provision for income taxes is determined, in part, through the use of significant estimates and judgments. Numerous transactions arise in the ordinary course of business where the ultimate tax determination is uncertain. The company undergoes tax examinations by various worldwide tax authorities on a regular basis. While the company believes its estimates of its tax obligations are reasonable, the final outcome after the conclusion of any tax examinations and any litigation could be materially different from what has been reflected in the company’s historical financial statements.
Technological risks
Decreases in our ability to develop or apply new technology and know-how may affect our competitiveness.
Our success depends partially on our ability to improve production processes and services. We must also introduce new products and services to meet changing customer needs. If we are unable to implement better production processes or to develop new products through research and development or licensing of new technology, we may not be able to remain competitive with other manufacturers. As a result, our business, financial condition, cash flows or results of operations could be adversely affected.
Increased information technology (IT) security threats and more sophisticated and targeted computer crime could pose a risk to our systems, networks, products, solutions and services, as well as those of our suppliers and customers.
The company’s IT systems, or any third party’s system on which the company relies, as well as those of our suppliers and customers, could fail on their own accord or may be vulnerable to a variety of interruptions or shutdowns, including interruptions or shutdowns due to natural disasters, power outages or telecommunications failures, terrorist attacks or failures during the process of upgrading or replacing software or hardware. Increased global IT security threats and more sophisticated and targeted computer crime also pose a risk to the security of our systems and networks and the confidentiality, availability and integrity of our data, as well as to the security and data of our suppliers and customers. The company has a number of shared service centers where many of the company’s IT systems are concentrated and any disruption at such a location could impact the company’s business within the operating zones served by the impacted service center.
While we attempt to mitigate all of these risks to our networks, systems and data by employing a number of measures, including employee training, comprehensive monitoring of our networks and systems, and maintenance of backup and protective systems, our systems, networks, products, solutions and services remain potentially vulnerable to advanced persistent threats or other IT disruptions. Depending on their nature and scope, such threats could potentially lead to the compromise of confidential information, improper use of our systems and networks, manipulation and destruction of data, defective products, harm to individuals or property, contractual or regulatory actions and fines, penalties and potential liabilities, production downtimes and operational disruptions, which in turn could adversely affect our reputation, competitiveness and results of operations. Data privacy and protection laws are evolving and present increasing compliance challenges, which may increase our costs, affect our competitiveness and could expose us to substantial fines or other penalties.
17
Human capital risks
If we fail to retain key management and personnel, we may be unable to implement our key objectives.
We believe our future success depends, in part, on our experienced management team. Unforeseen losses of key members of our management team without appropriate succession and/or compensation planning could make it difficult for us to manage our business and meet our objectives.
Prolonged work stoppages at facilities with union employees could jeopardize our financial position.
As of December 31, 2025, 20 percent of our North American employees and 33 percent of our European employees were covered by collective bargaining agreements. These collective bargaining agreements have staggered expirations during the next several years. Although we consider our employee relations to be generally good, a prolonged work stoppage or strike at any facility with union employees could have a material adverse effect on our business, financial condition, cash flows or results of operations. In addition, we cannot ensure that upon the expiration of existing collective bargaining agreements, new agreements will be reached without union action or that any such new agreements will be on terms satisfactory to us.
Environmental risks
Adverse weather and climate changes may result in lower sales.
We manufacture packaging products primarily for beverages. Unseasonable weather can reduce demand for certain beverages packaged in our containers. Climate changes and the increasing frequency of severe weather events could have various effects on the demand for our products, our supply chain and the costs of inputs to our production and delivery of products in different regions around the world. Our plants’ production may be prevented or curtailed due to severe or unanticipated weather and climate events.
Our business is subject to substantial environmental remediation and compliance costs.
Our operations are subject to federal, state, provincial and local laws and regulations in multiple jurisdictions relating to environmental hazards, such as emissions to air, discharges to water, the handling and disposal of hazardous and solid wastes and the clean-up of hazardous substances. We have been designated, along with numerous other companies, as a potentially responsible party for the clean-up of several hazardous waste sites. Additionally, there is increased focus on the regulation of greenhouse gas emissions and other environmental issues worldwide. We strive to mitigate such risks related to environmental issues, including through the purchase of renewable energy, the adoption of sustainable practices, and by positioning ourselves as a sustainability leader in our industry.
Item 1B. Unresolved Staff Comments
There were no matters required to be reported under this item.
Item 1C. Cybersecurity
Risk management and strategy
Ball Corporation is committed to maintaining a strong cybersecurity posture.
The company employs a standards-based cybersecurity program aligned to the National Institute of Standards and Technology (NIST) Cybersecurity Framework (CSF), including ongoing assessment and continuous improvement to address the rapidly evolving threat landscape. Ball partners closely with a strong network of third-party security partners, including conducting annual assessments of the cyber risk management program against the NIST CSF.
Our information security team has established and implemented formal processes and policies to assess, identify, and manage risks arising from cybersecurity threats, including those associated with our internal operations and the use of
18
third-party service providers. We continually refine our approach to address evolving cybersecurity regulations, identify potential and emerging security risks (including AI-driven phishing and supply chain attacks), and implement strategies to manage these risks. Ball has developed an incident response plan that includes a cyber incident materiality assessment with appropriate leadership governance. In addition, we have aligned our incident response plan with our enterprise risk and global crisis management processes.
In response to the ever-evolving cyber threat landscape, Ball utilizes external experts to support continuous improvement across our cyber program, processes and operations.
We are aware that there are potential cybersecurity risks associated with third-party service providers.
Ball faces risks from cybersecurity threats that could have a material adverse effect on the company, including its business strategy, results of operations, financial condition and reputation. Refer to Item 1A, Risk Factors – Technological Risks, for additional details on cybersecurity risks that could potentially materially affect the company, including its business strategy, results of operations, financial condition and reputation.
Governance
Ball’s
Our
Item 2. Properties
The company’s properties described below are well maintained, and management considers them to be adequate and utilized for their intended purposes.
Ball’s corporate headquarters are located in Westminster, Colorado, U.S. Ball’s manufacturing locations, which are owned or leased by the company, are set forth below. Facilities in the process of being constructed, or that have permanently ceased production, have been excluded from the list. In addition to the facilities listed, the company leases other warehousing space.
Beverage packaging, North and Central America, locations:
| ● | Bowling Green, Kentucky |
| ● | Conroe, Texas |
| ● | Fairfield, California |
| ● | Findlay, Ohio |
| ● | Fort Atkinson, Wisconsin |
19
| ● | Fort Worth, Texas |
| ● | Glendale, Arizona |
| ● | Golden, Colorado |
| ● | Goodyear, Arizona |
| ● | Kapolei, Hawaii |
| ● | Monterrey, Mexico |
| ● | Monticello, Indiana |
| ● | Pittston, Pennsylvania |
| ● | Queretaro, Mexico |
| ● | Rome, Georgia |
| ● | Saratoga Springs, New York |
| ● | Tampa, Florida |
| ● | Whitby, Ontario, Canada |
| ● | Williamsburg, Virginia |
| ● | Winter Haven, Florida |
Beverage packaging, EMEA, locations:
| ● | Belgrade, Serbia |
| ● | Bierne, France |
| ● | Cabanillas del Campo, Spain |
| ● | Cairo, Egypt |
| ● | Ejpovice, Czech Republic |
| ● | Fosie, Sweden |
| ● | Fredericia, Denmark |
| ● | Gelsenkirchen, Germany |
| ● | Kettering, United Kingdom |
| ● | La Selva, Spain |
| ● | Lublin, Poland |
| ● | Ludesch, Austria |
| ● | Manisa, Turkey |
| ● | Mantsala, Finland |
| ● | Milton Keynes, United Kingdom |
| ● | Mont, France |
| ● | Nogara, Italy |
| ● | Pilsen, Czech Republic |
| ● | Wakefield, United Kingdom |
| ● | Waterford, Ireland |
| ● | Widnau, Switzerland |
Beverage packaging, South America, locations:
| ● | Aguas Claras, Brazil |
| ● | Asuncion, Paraguay |
| ● | Brasilia, Brazil |
| ● | Buenos Aires, Argentina |
| ● | Extrema, Brazil |
| ● | Frutal, Brazil |
| ● | Jacarei, Sao Paulo, Brazil |
| ● | Manaus, Brazil |
| ● | Pouso Alegre, Brazil |
| ● | Recife, Brazil |
| ● | Santiago, Chile |
| ● | Tres Rios, Rio de Janeiro, Brazil |
Beverage packaging, Other, locations:
| ● | Mumbai, India |
| ● | Sri City, India |
| ● | Yangon, Myanmar |
Personal & home care locations:
| ● | Beaurepaire, France |
| ● | Bellegarde, France |
20
| ● | Devizes, United Kingdom |
| ● | Itupeva, Brazil |
| ● | Llinars del Vallés, Spain |
| ● | Lummen, Belgium |
| ● | San Luis Potosí, Mexico |
| ● | Sherbrooke, Quebec, Canada |
| ● | Velim, Czech Republic |
Item 3. Legal Proceedings
Details of the company’s legal proceedings are included in Note 22 to the consolidated financial statements within Item 8 of this annual report.
Item 4. Mine Safety Disclosures
Not applicable.
Part II.
Item 5. Market for Registrant’s Common Equity, Related Stockholder Matters and Issuer Purchases of Equity Securities.
Ball Corporation common stock is listed for trading on the New York Stock Exchange under the ticker symbol BALL. There were 7,385 common shareholders of record on February 17, 2026.
Common Stock Repurchases
The following table summarizes the company’s repurchases of its common stock during the fourth quarter of 2025.
Purchases of Securities | ||||||||||
| Total Number of Shares Purchased (a) | | Average Price Paid per Share | | Total Number of Shares Purchased as Part of Publicly Announced Plans or Programs (a) | | Maximum Value of Shares that May Yet Be Purchased Under the Plans or Programs (b) | |||
October 1 to October 31, 2025 | 1,856,168 | $ | 48.95 | 1,856,168 | $ | 3,049,987,369 | ||||
November 1 to November 30, 2025 | 2,314,651 | 48.40 | 2,314,651 | 2,939,112,414 | ||||||
December 1 to December 31, 2025 | 285,600 | 49.28 | 285,600 | 2,925,127,964 | ||||||
Total | 4,456,419 | 4,456,419 | ||||||||
(a) | Includes any open market purchases (on a trade-date basis), share repurchase agreements and/or shares retained by the company to settle employee withholding tax liabilities. |
(b) | The company has an ongoing repurchase program for which shares are authorized from time to time by Ball’s Board of Directors. On January 29, 2025, the Board approved the repurchase by the company of up to $4.00 billion in shares of its common stock through the end of 2027. This repurchase authorization replaced all previous authorizations. |
21
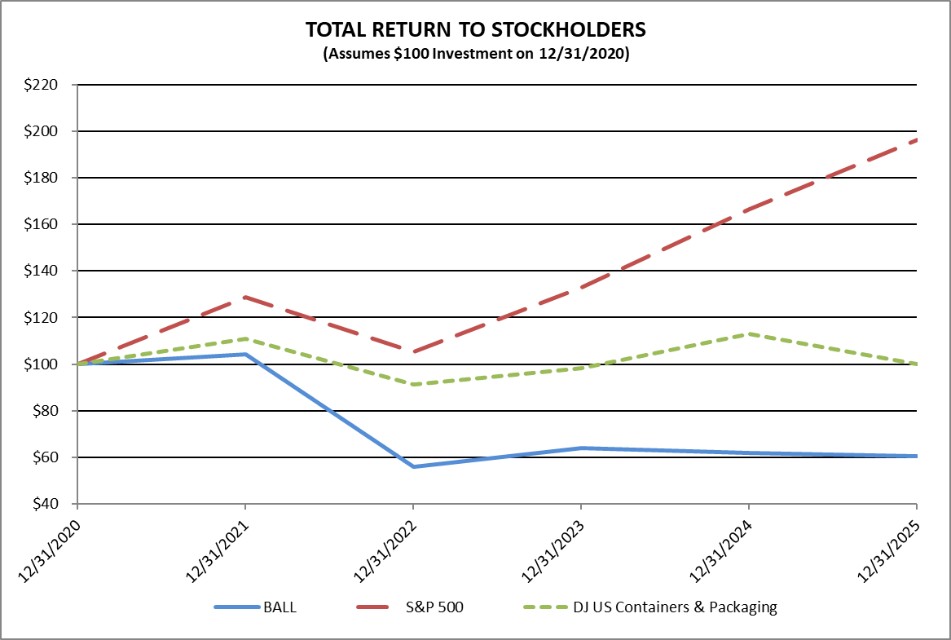
Shareholder Return Performance
The line graph below compares the annual percentage change in Ball Corporation’s cumulative total shareholder return on its common stock with the cumulative total return of the Dow Jones Containers & Packaging Index and the S&P Composite 500 Stock Index for the five-year period ended December 31, 2025. The graph assumes $100 was invested on December 31, 2020, and that all dividends were reinvested. The Dow Jones Containers & Packaging Index total return has been weighted by market capitalization.
Total Return Analysis
12/31/2020 | 12/31/2021 | 12/31/2022 | 12/31/2023 | 12/31/2024 | 12/31/2025 | |||||||||||||
BALL | $ | 100.00 | $ | 104.13 | $ | 55.99 | $ | 63.91 | $ | 62.01 | $ | 60.52 | ||||||
S&P 500 | 100.00 | 128.71 | 105.40 | 133.10 | 166.40 | 196.16 | ||||||||||||
DJ US Containers & Packaging | 100.00 | 110.96 | 91.21 | 98.16 | 112.83 | 99.86 | ||||||||||||
Source: Bloomberg
Item 6. [Reserved]
Removing and reserving Item 6 of Part II.
22
Item 7. Management’s Discussion and Analysis of Financial Condition and Results of Operations
Management’s discussion and analysis should be read in conjunction with the consolidated financial statements and accompanying notes included in Item 8 of this Annual Report on Form 10-K (annual report), which include additional information about our accounting policies, practices and the transactions underlying our financial results. The preparation of our consolidated financial statements in conformity with accounting principles generally accepted in the United States of America (U.S. GAAP) requires us to make estimates and assumptions that affect the reported amounts in our consolidated financial statements and the accompanying notes, including various claims and contingencies related to lawsuits, taxes, environmental and other matters arising during the normal course of business. We apply our best judgment, our knowledge of existing facts and circumstances and actions that we may undertake in the future in determining the estimates that affect our consolidated financial statements. We evaluate our estimates on an ongoing basis using our historical experience, as well as other factors we believe appropriate under the circumstances, such as current economic conditions, and adjust or revise our estimates as circumstances change. As future events and their effects cannot be determined with precision, actual results may differ from these estimates. Ball Corporation and its subsidiaries are referred to collectively as “Ball Corporation,” “Ball,” “the company,” “we” or “our” in the following discussion and analysis.
OVERVIEW
Business Overview and Industry Trends
Ball Corporation is one of the world’s leading aluminum packaging suppliers. With a growth mindset and by pursuing operational excellence, we lean on our competitive strengths to reach our financial goals. We are focused on maintaining our strong financial position by listening to and partnering with our global customers, delivering operational efficiencies and an innovative product portfolio from our best-in-class manufacturing facilities and returning value to shareholders via share repurchases and dividends. In the aluminum packaging industry, sales and earnings can be increased by reducing costs, increasing prices, developing new products, expanding volume and making strategic acquisitions.
We sell our aluminum packaging products mainly to large, multinational beverage, personal care and household products companies with which we have developed long-term relationships. This is evidenced by our high customer retention and our large number of long-term supply contracts. While we have a diversified customer base, we sell a significant portion of our packaging products to major companies and brands, as well as to numerous regional customers. The overall global aluminum packaging industry is growing and is expected to continue to grow in the medium to long term.
We purchase our raw materials from relatively few suppliers. We also have exposure to inflation, in particular the rising costs of raw materials, as well as other direct cost inputs. We mitigate our exposure to the changes in the costs of aluminum through the inclusion of provisions in contracts covering the majority of our volumes to pass-through aluminum price changes, as well as through the use of derivative instruments. The pass-through provisions generally result in proportional increases or decreases in sales and costs with a greatly reduced impact, if any, on net earnings; however, there may be timing differences of when the costs are passed through. Because of our customer and supplier concentration, our business, financial condition and results of operations could be adversely affected by the loss, insolvency or bankruptcy of a major customer or supplier or a change in a supply agreement with a major customer or supplier, although our contract provisions generally mitigate the risk of customer loss, and our long-term relationships represent a known, stable customer base.
From time to time, we have evaluated and expect to continue to evaluate possible transactions that we believe will benefit the company and our shareholders, which may include strategic acquisitions, divestitures of parts of our company or equity investments. At any time, we may be engaged in discussions or negotiations at various stages of development with respect to one or more possible transactions or may have entered into non-binding letters of intent. As part of any such initiatives, we may participate in processes being run by other companies or leading our own activities.
23
RESULTS OF OPERATIONS
Management’s discussion and analysis for our results of operations on a consolidated and segment basis include a quantification of factors that had a material impact. Other factors that did not have a material impact, but that are significant to understand the results, are qualitatively described.
Refer to Item 7. Management’s Discussion and Analysis of Financial Condition and Results of Operations of the company’s Annual Report on Form 10-K for the year ended December 31, 2024, as filed on February 20, 2025, for a comparison of our 2024 results of operations to the 2023 results. On February 16, 2024, the company completed the divestiture of its aerospace business. Effective as of the first quarter of 2024, the company reports its financial performance in three reportable segments: (1) beverage packaging, North and Central America; (2) beverage packaging, Europe, Middle East and Africa (beverage packaging, EMEA) and (3) beverage packaging, South America. See Note 1 for further information on the basis of presentation. As a result of the divestiture, prior periods disclosed herein reflect the aerospace business’ financial results as discontinued operations.
Consolidated Sales and Earnings
Years Ended December 31, | ||||||||||
($ in millions) | | 2025 | | 2024 | | 2023 |
| |||
Net sales | $ | 13,161 | $ | 11,795 | $ | 12,062 | ||||
Net earnings attributable to Ball Corporation | 912 | 4,008 | 707 | |||||||
Net earnings attributable to Ball Corporation as a % of net sales | 7 | % | 34 | % | 6 | % | ||||
Sales in 2025 increased $1.37 billion compared to 2024 primarily due to increases of $713 million from higher volume, $579 million from price mix, primarily from higher aluminum prices, and $177 million from currency translation.
Net earnings attributable to Ball Corporation in 2025 decreased $3.10 billion compared to 2024 primarily due to decreases of $3.58 billion from discontinued operations, net of tax, $107 million from a higher provision for income taxes and $41 million from lower interest income in corporate undistributed expenses, net, partially offset by decreases in costs of $461 million from business consolidation and other activities, $82 million from lower incremental compensation costs related to the successful sale of the aerospace business in 2024 and $135 million from the results of the reportable segments discussed below.
When analyzing net earnings attributable to Ball Corporation as a percentage of net sales, it is important to note that net earnings attributable to Ball Corporation includes discontinued operations, net of tax resulting from the net sales attributable to the historical aerospace reportable segment through the date of the divestiture on February 16, 2024, that are now reported as discontinued operations. However, net sales attributable to the historical aerospace reportable segment are not included in the net sales figures in the table above.
Cost of Sales (Excluding Depreciation and Amortization)
Cost of sales, excluding depreciation and amortization, was $10.58 billion in 2025 compared to $9.35 billion in 2024. These amounts represented 80 percent and 79 percent of consolidated net sales for the years ended 2025 and 2024, respectively. The increase year-over-year was primarily due to higher manufacturing costs, including higher raw materials costs of $1.09 billion, driven by higher aluminum prices and higher volume, and other items discussed in the reportable segments below.
Depreciation and Amortization
Depreciation and amortization expense was $622 million in 2025 compared to $611 million in 2024. These amounts represented 5 percent of consolidated net sales for the years ended 2025 and 2024.
24
Selling, General and Administrative
Selling, general and administrative (SG&A) was $566 million in 2025 compared to $647 million in 2024. These amounts represented 4 percent and 5 percent of consolidated net sales for the years ended 2025 and 2024, respectively. The decrease was primarily due to 2024 including $82 million of incremental cash bonuses and stock-based compensation cost from the successful sale of the aerospace business.
Business Consolidation and Other Activities
Business consolidation and other activities resulted in income of $41 million in 2025 compared to charges of $420 million in 2024. These amounts represented less than 1 percent and 4 percent of consolidated net sales for 2025 and 2024, respectively. The amounts in 2025 primarily include an $81 million gain related to the sale of the Saudi Arabian business and costs for previously announced facility closures and a loss related to the aluminum cups transaction. The 2024 amounts primarily relate to a $233 million noncash charge to adjust the carrying value of the aluminum cups business to its fair value less cost to sell and facility shutdown costs. Further details regarding business consolidation and other activities are provided in Note 6.
Interest Income
Interest income was $30 million in 2025 compared to $68 million in 2024. These amounts represented less than 1 percent of consolidated net sales for the years ended 2025 and 2024. The decrease in interest income was primarily due to the higher amount of cash on hand in 2024 from the sale of the aerospace business.
Interest Expense
Interest expense was $314 million in 2025 compared to $293 million in 2024. Interest expense as a percentage of average borrowings decreased by approximately 30 basis points from 4.8 percent in 2024 to 4.5 percent in 2025. The interest expense increase was primarily driven by an increase of $42 million from a higher amount of weighted average principal outstanding during the year, resulting mainly from the issuance of new notes, partially offset by a decrease of $21 million from lower weighted average interest rates on outstanding debt during the year.
Tax Provision
The company’s effective tax rate is affected by recurring items such as income earned in non-U.S. jurisdictions with tax rates that differ from the U.S. tax rate and by discrete items that may occur in any given year but are not consistent from year to year.
The 2025 effective income tax rate was 21.3 percent compared to 24.9 percent for 2024. As compared with the statutory U.S. federal income tax rate of 21 percent, the 2025 effective income tax rate was reduced by 4.2 percent for the impact of tax holidays and by 2.0 percent for the sale of the Saudi Arabian business. This reduction was offset by an increase of 2.4 percent for non-U.S. tax rate differences, 2.0 percent for direct withholding taxes, net of credits, and 1.3 percent for state and local income taxes. While these items are expected to recur, the potential magnitude of each item is uncertain.
Further details of taxes on income are provided in Note 16 to the consolidated financial statements within Item 8 of this annual report.
RESULTS OF BUSINESS SEGMENTS
Segment Results
Ball’s operations are organized and reviewed by management along its product lines and geographical areas, and its operating results are presented in the three reportable segments discussed below.
25
Beverage Packaging, North and Central America
Years Ended December 31, | |||||||||||
($ in millions) | | 2025 | | 2024 | | 2023 |
| ||||
Net sales | $ | 6,286 | $ | 5,619 | $ | 5,963 | |||||
Comparable operating earnings | 772 | 747 | 710 | ||||||||
Comparable operating earnings as a % of segment net sales | 12 | % | 13 | % | 12 | % | |||||
Ball acquired an aluminum beverage can manufacturing facility in Winter Haven, Florida, in the first quarter of 2025 as part of its acquisition of Florida Can Manufacturing and permanently ceased production at its aluminum beverage can manufacturing facility in Kent, Washington, in the first quarter of 2024. See Note 4 for further details on the acquisition.
Segment sales in 2025 were $667 million higher compared to 2024 primarily due to increases of $291 million from higher volume and $375 million from price/mix.
Comparable operating earnings in 2025 were $25 million higher compared to 2024 primarily due to an increase of $98 million from higher volumes, partially offset by decreases of $49 million from higher costs and $23 million from price/mix.
Beverage Packaging, EMEA
Years Ended December 31, | ||||||||||
($ in millions) | 2025 | | 2024 | | 2023 |
| ||||
Net sales | $ | 3,983 | $ | 3,466 | $ | 3,395 | ||||
Comparable operating earnings | 495 | 416 | 354 | |||||||
Comparable operating earnings as a % of segment net sales | 12 | % | 12 | % | 10 | % | ||||
Segment sales in 2025 were $517 million higher compared to 2024 primarily due to increases of $251 million from higher volume, $171 million from currency translation and $103 million from price/mix.
Comparable operating earnings in 2025 were $79 million higher compared to 2024 primarily due to increases of $75 million from higher volume and $42 million from price/mix, partially offset by $62 million higher costs.
Beverage Packaging, South America
Years Ended December 31, | ||||||||||
($ in millions) | 2025 | | 2024 | | 2023 |
| ||||
Net sales | $ | 2,162 | $ | 1,951 | $ | 1,960 | ||||
Comparable operating earnings | 327 | 296 | 266 | |||||||
Comparable operating earnings as a % of segment net sales | 15 | % | 15 | % | 14 | % | ||||
Segment sales in 2025 were $211 million higher compared to 2024 primarily due to increases of $136 million from higher volume and $73 million from price/mix.
Comparable operating earnings in 2025 were $31 million higher compared to 2024 primarily due to an increase of $52 million from higher volume and $39 million from price/mix, partially offset by a decrease of $60 million from higher costs.
CRITICAL ACCOUNTING POLICIES AND ESTIMATES
For information regarding the company’s significant accounting policies, as well as recent accounting pronouncements, see Note 1 and Note 2 to the consolidated financial statements within Item 8 of this annual report.
26
The company considers certain accounting estimates to be critical, as their application is made in accordance with generally accepted accounting principles that involve a significant level of estimation uncertainty and have had, or are reasonably likely to have, a material impact on the financial condition or results of operations. Detailed below is a discussion of why, to the extent the estimate is material, these estimates are subject to uncertainty and the sensitivity of the reported amounts to the methods and assumptions underlying the estimate’s calculation.
Defined Benefit Pension Plans
The company has defined benefit plans which require management to make assumptions relating to the long-term rate of return on plan assets, discount rates used to determine the present value of future obligations and expenses, salary inflation rates, mortality rates and other assumptions. The company believes the accounting estimates related to its pension plans are critical accounting estimates because several of the company’s defined benefit plans have significant asset and liability balances, and because the assumptions used are highly susceptible to change from period to period based on the performance of plan assets, actuarial valuations, market conditions and contracted benefit changes. These assumptions do not change during the company’s fiscal year unless a remeasurement event occurs in one of the plans, such as a significant settlement. The assumptions used in accounting for the company’s defined benefit plans and how they have changed over time, as well as the sensitivity of the plans to changes in their related assumptions, can be found in Note 17 to the consolidated financial statements within Item 8 of this annual report.
FINANCIAL CONDITION, LIQUIDITY AND CAPITAL RESOURCES
Cash Flows and Capital Expenditures
Our primary sources of liquidity are cash provided by operating activities and external borrowings. We believe that cash flows from operating activities, even in the absence of operating cash flows from the historical aerospace reportable segment, and cash provided by short-term, long-term and committed revolver borrowings, when necessary, will be sufficient to meet our ongoing operating requirements, scheduled principal and interest payments on debt, dividend payments, anticipated share repurchases and anticipated capital expenditures. The following table summarizes our cash flows:
Years Ended December 31, | |||||||||
($ in millions) | | 2025 | | 2024 | | 2023 | |||
Cash flows provided by (used in) operating activities | $ | 1,262 | $ | 115 | $ | 1,863 | |||
Cash flows provided by (used in) investing activities | (656) | 5,003 | (1,053) | ||||||
Cash flows provided by (used in) financing activities | (344) | (4,790) | (662) | ||||||
Cash flows from the historical aerospace reportable segment are presented within each cash flow statement category in the consolidated statements of cash flows. Depreciation and amortization, capital expenditures and significant operating and investing noncash items of the aerospace discontinued operation are presented in Note 4.
Cash flows provided by operating activities were $1.26 billion in 2025, primarily driven by earnings from continuing operations of $915 million, along with reconciling adjustments to operating cash flows of $478 million and working capital outflows of $131 million. We have estimated a total cash tax of $830 million for the sale of the aerospace business, of which $766 million was paid in 2024 and $168 million was paid in 2025. In January 2026, the company received a refund of $104 million related to these payments. See Note 4 for further details. In a dynamic economic environment, payment terms with our customers and vendors become a more important element of total mix of information used to negotiate our contract terms. At December 31, 2025, a change of one day in days sales outstanding will impact cash flows provided by (used in) operating activities by $37 million, a change of one day in days payable outstanding will impact cash flows provided by (used in) operating activities by $30 million and a change of one day in days inventory on hand will impact cash flows provided by (used in) operating activities by $30 million.
Cash flows used in investing activities were $656 million in 2025, primarily driven by capital expenditures of $474 million, $160 million of cash consideration used for the acquisition of Florida Can Manufacturing and $99 million of derivative settlements, partially offset by $32 million from dispositions.
27
Cash flows used in financing activities were $344 million in 2025, primarily driven by net borrowings of long-term and short-term borrowings of $1.23 billion, offset by repurchases of common stock of $1.32 billion and dividends of $220 million. See Note 15 for further details on the company’s borrowings and additional amounts available.
We have entered into several regional accounts receivable factoring programs with various financial institutions for certain of our accounts receivables. The programs are accounted for as true sales of the receivables, with limited recourse to Ball, and had combined limits of approximately $1.82 billion and $1.60 billion at December 31, 2025 and 2024, respectively. A total of $364 million and $428 million were available for sale under these programs as of December 31, 2025 and 2024, respectively. The company has recorded $38 million, $44 million and $93 million of expense related to its factoring programs in 2025, 2024 and 2023, respectively, and has presented these amounts in selling, general and administrative in its consolidated statements of earnings.
The company has several regional supplier finance programs with various financial institutions that act as the paying agent for certain payables of the company. The amount of obligations outstanding that the company confirmed as valid to the financial institutions under the company's programs was $424 million and $423 million at December 31, 2025 and 2024, respectively. Our payment terms are not dependent on whether the suppliers participate in the supplier finance programs or if the suppliers decide to factor their receivables with the financial institutions; therefore, we do not believe that future changes in the availability of supplier finance programs will have a significant impact on our liquidity.
Contributions to the company’s defined benefit pension plans were $43 million and $32 million for the years ended 2025 and 2024, respectively. Contributions are expected to be approximately $29 million for the full year of 2026. This estimate may change based on changes in the Pension Protection Act, actual plan asset performance and available company cash flow, among other factors.
As of December 31, 2025, approximately $1.00 billion of our cash was held outside of the U.S. In the event that we would need to utilize any of the cash held outside of the U.S. for purposes within the U.S., there are no material legal or other economic restrictions regarding the repatriation of cash from any of the countries outside the U.S. where we have cash. The company believes its U.S. operating cash flows and cash on hand, as well as availability under its long-term, revolving credit facilities, uncommitted short-term credit facilities and accounts receivable factoring programs, will be sufficient to meet the cash requirements of the U.S. portion of our ongoing operations, scheduled principal and interest payments on U.S. debt, dividend payments, capital expenditures and other U.S. cash requirements. If non-U.S. funds are needed for our U.S. cash requirements and we are unable to provide the funds through intercompany financing arrangements, we may be required to repatriate funds from non-U.S. locations where the company has previously asserted indefinite reinvestment of funds outside the U.S.
Based on its indefinite reinvestment assertion, the company has not provided deferred taxes on earnings in certain non-U.S. subsidiaries because such earnings are intended to be indefinitely reinvested in its international operations. It is not practical to estimate the additional taxes that might become payable if these earnings were remitted to the U.S.
Share Repurchases
The company’s share repurchases were $1.32 billion in 2025 and $1.71 billion in 2024. The repurchases were completed using cash on hand, cash provided by operating activities, proceeds from the sale of businesses and available borrowings. The company plans to continue capital return to shareholders via an estimated $600 million in share repurchases in 2026.
On January 29, 2025, the Board of Directors approved the repurchase by the company of up to a total of $4.00 billion in shares of its common stock. This repurchase authorization replaced all previous authorizations. At December 31, 2025, $2.93 billion remains available to be repurchased.
Debt Facilities and Refinancing
Given our cash flow projections and unused credit facilities that are available until June 2030, our liquidity is strong and is expected to meet our ongoing cash and debt service requirements. Total debt of $7.01 billion and $5.69 billion was outstanding at December 31, 2025 and 2024, respectively.
28
On November 25, 2025 Ball refinanced its existing senior credit facilities which were previously amended in 2022. The company’s senior credit facilities include a $1.50 billion term loan and long-term multi-currency revolving facilities that mature in November 2030, which provide the company with up to U.S. dollar equivalent of $2.00 billion. On November 17, 2025, Ball redeemed all of the outstanding principal of the $750 million of 6.875% senior notes due in March 2028. On December 15, 2025, Ball redeemed all of the outstanding principal of the $256 million of 4.875% senior notes due in March 2026.
In August 2025, Ball issued $750 million of 5.50% senior notes due in 2033 and repaid the outstanding U.S. dollar revolving credit facility due in 2027 in the amount of $600 million, as well as the outstanding multi-currency revolving credit facility due in 2027 of $100 million.
In July 2025, Ball repaid at maturity the outstanding 5.25% senior notes due in the amount of $189 million.
In May 2025, Ball issued €850 million of 4.25% senior notes due in 2032 and repaid a portion of the U.S. dollar revolving credit facility due in 2027 in the amount of $500 million, as well as the outstanding multi-currency revolving credit facility due in 2027 of $200 million.
At December 31, 2025, approximately $1.95 billion was available under the company’s long-term, multi-currency committed revolving credit facilities. The company also had approximately $998 million of short-term uncommitted credit facilities available at December 31, 2025, of which $19 million was outstanding and due on demand. At December 31, 2024, the company had $109 million of committed short-term loans outstanding and a $24 million short-term finance lease outstanding.
While ongoing financial and economic conditions in certain areas may raise concerns about credit risk with counterparties to derivative transactions, the company mitigates its exposure by allocating the risk among various counterparties and limiting exposure to any one party. We also monitor the credit ratings of our suppliers, customers, lenders and counterparties on a regular basis.
We were in compliance with the leverage ratio requirement at December 31, 2025, and for all prior years presented, and have met all debt payment obligations. The U.S. note agreements and bank credit agreement contain certain restrictions relating to dividend payments, share repurchases, investments, financial ratios, guarantees and the incurrence of additional indebtedness. The most restrictive of our debt covenants requires us to maintain a leverage ratio (as defined) of no greater than 4.5 times. As of December 31, 2025, the company could borrow an additional $2.66 billion, without violating its debt covenants, under its long-term multi-currency committed revolving facilities and short-term uncommitted credit facilities. Additional details about our debt are available in Note 15 accompanying the consolidated financial statements within Item 8 of this annual report. In 2024 and 2025, we entered into and designated net investment hedges against the net assets of our euro denominated operations. See Note 21 for further details.
Saudi Arabia
In August 2025, the company sold 41 percent of its share in Ball United Arab Can Manufacturing Company, which resulted in deconsolidation upon closing of the transaction. See Note 4 for further details.
Defined Benefit Pension Plans
In November 2023, the Trustee Board of the U.K. defined benefit pension plan entered into an agreement with an insurance company for a bulk annuity purchase, or “buy-in,” for its U.K. defined benefit pension plan to reduce retirement plan risk, while delivering promised benefits to plan participants. The plan was frozen on April 5, 2024. See Note 17 for further details.
Other Liquidity Measures
The company expects that 2026 capital expenditures for property, plant and equipment will likely be in the range of $600 million and we intend to return approximately $210 million to shareholders in the form of dividends. We further intend to utilize our operating cash flows, when available, to repurchase Ball common stock or fund acquisitions that meet our rate of return criteria.
29
We have committed contracts to purchase raw materials and we align these purchase commitments with long-term sales contracts with our customers such that any commitment to purchase aluminum and other direct materials corresponds to a contractual sale. These sales contracts include pass-through provisions which generally result in proportional changes in both sales and costs of sales; however, there may be timing differences of when the costs are passed through.
The company’s growth and asset maintenance plans require capital expenditures over the coming years, which will be funded by operating cash flows and external borrowings. Approximately $320 million of capital expenditures were contractually committed as of December 31, 2025. Maturities for Ball’s long-term debt are disclosed in Note 15 to the consolidated financial statements within Item 8 of this annual report. Repayments of debt and other operational cash requirements will also be funded by operating cash flows and external borrowings.
CONTINGENCIES, INDEMNIFICATIONS AND GUARANTEES
Details of the company’s contingencies, legal proceedings, indemnifications and guarantees are available in Note 22 and Note 23 to the consolidated financial statements within Item 8 of this annual report. The company is routinely subject to litigation incidental to operating its businesses and has been designated by various federal, state, and international environmental agencies as a potentially responsible party, along with numerous other companies, for the clean-up of several hazardous waste sites. The company believes the matters identified will not have a material adverse effect upon its liquidity, results of operations or financial condition.
Guaranteed Securities
The company’s senior notes are guaranteed on a full and unconditional, joint and several basis by the issuer of the company’s senior notes and the subsidiaries that guarantee the notes (the obligor group). The entities that comprise the obligor group are 100 percent owned by the company. As described in the supplemental indentures governing the company’s existing senior notes, the senior notes are guaranteed by any of the company’s domestic subsidiaries that guarantee any other indebtedness of the company.
The following summarized financial information relates to the obligor group as of and for the years ended December 31, 2025 and 2024. Intercompany transactions, equity investments and other intercompany activity between obligor group subsidiaries have been eliminated from the summarized financial information. Investments in subsidiaries not forming part of the obligor group have also been eliminated.
Year Ended | |||
($ in millions) | December 31, 2025 | ||
Net sales | $ | 6,372 | |
Gross profit (a) | 853 | ||
Net earnings | 405 | ||
Net earnings attributable to Ball Corporation | 405 | ||
| (a) | Gross profit is shown after depreciation and amortization related to cost of sales of $164 million for the year ended December 31, 2025. |
December 31, | |||
($ in millions) | | 2025 | |
Current assets | $ | 2,222 | |
Noncurrent assets | 13,453 | ||
Current liabilities | 3,399 | ||
Noncurrent liabilities | 12,761 | ||
30
Included in the amounts disclosed in the tables above, at December 31, 2025, the obligor group held receivables due from other subsidiary companies of $503 million, long-term notes receivable due from other subsidiary companies of $9.93 billion, payables due to other subsidiary companies of $1.09 billion and long-term notes payable due to other subsidiary companies of $4.97 billion.
For the years ended December 31, 2025, the obligor group recorded the following transactions with other subsidiary companies: sales to them of $736 million, net credits from them of $68 million, and net interest income from them of $250 million.
A description of the terms and conditions of the company’s debt guarantees is located in Note 23 to the consolidated financial statements within Item 8 of this annual report.
FORWARD-LOOKING STATEMENTS
This report and other public filings, earnings news releases, quarterly earnings conference calls and other written and oral communications made by Ball contain statements which are not historical facts and constitute “forward-looking” statements as that term is used in the Private Securities Litigation Reform Act of 1995 (the “Reform Act”). Forward-looking statements are generally statements that express or imply an expectation or belief concerning future events or financial performance. Words such as “expects,” “anticipates,” “estimates,” “will,” “believe,” “continue,” “goal” and similar expressions typically identify forward looking statements. Such statements are based on current expectations or views of the future and are subject to risks and uncertainties, which could cause actual results or events to differ materially from those expressed or implied. Ball undertakes no obligation to publicly update or revise any forward-looking statements, whether as a result of new information, future events or otherwise. Forward-looking statements are not guarantees of future performance, and you should therefore not place undue reliance upon such statements. Rather, these statements involve estimates, assumptions uncertainties and known and unknown risks, many of which are outside our control, and such statements are therefore qualified in their entirety by reference to the factors listed below and the risks discussed in Item 1A, Risk Factors and elsewhere in this report. Additional important factors include among others: supply and demand constraints, fluctuations and changes in consumption patterns; availability/cost of raw materials, equipment, and logistics; competitive packaging, pricing and substitution; power and supply chain interruptions; customer and supplier consolidation; changes in major customer or supplier contracts or loss of a major customer or supplier; inability to pass-through increased costs; footprint adjustments and other manufacturing changes, including the opening and closing of facilities and lines; failure to achieve synergies, productivity improvements or cost reductions; war, political instability, sanctions, and other uncertainties surrounding geopolitical events and governmental policies including relating to the situation in Russia and Ukraine and its impact on Ball’s operations in Europe, the Middle East and Africa regions; changes in foreign exchange or tax rates; tariffs, trade actions, or other governmental actions; unfavorable mandatory deposit or packaging laws; regulatory actions or issues including those related to tax, environmental regulation, social and governance reporting, competition, health and workplace safety, including governmental actions or public concerns affecting products filled in Ball’s containers, or chemicals or substances used in raw materials or in the manufacturing process; changes in climate and weather and related events such as drought, wildfires, storms, hurricanes, tornadoes and floods; the extent to which sustainability-related opportunities arise and can be capitalized upon; changes in senior management, succession, and the ability to attract and retain skilled labor; strikes; disease; pandemic; labor cost changes; technological developments and innovations; the ability to manage cyber threats; litigation; inflation; pension changes; changes in the rates of return on assets of Ball’s defined benefit retirement plans; reduced cash flow; interest rates affecting Ball’s debt; successful or unsuccessful joint ventures, acquisitions and divestitures, and their effects on Ball’s operating results and business generally.
31
Item 7A. Quantitative and Qualitative Disclosures About Market Risk
Financial Instruments and Risk Management
The company employs established risk management policies and procedures which seek to reduce the company’s commercial risk exposure to fluctuations in commodity prices, interest rates, currency exchange rates, net investments in foreign operations and prices of the company’s common stock with regard to common share repurchases and the company’s deferred compensation stock plan. However, there can be no assurance that these policies and procedures will be successful. Although the instruments utilized involve varying degrees of credit, market and interest risk, the counterparties to the agreements are expected to perform fully under the terms of the agreements. The company monitors counterparty credit risk, including lenders, on a regular basis, but Ball cannot be certain that all risks will be discerned or that its risk management policies and procedures will always be effective. Additionally, in the event of default under the company’s master derivative agreements, the non-defaulting party has the option to set off any amounts owed with regard to open derivative positions.
We have estimated our market risk exposure using sensitivity analysis. Market risk exposure has been defined as the changes in fair value of derivative instruments, financial instruments and commodity positions. To test the sensitivity of our market risk exposure, we have estimated the changes in fair value of market risk sensitive instruments assuming a hypothetical 10 percent adverse change in market prices or rates. The results of the sensitivity analyses are summarized below.
Commodity Price Risk
Aluminum
We manage commodity price risk in connection with market price fluctuations of aluminum through two different methods. First, we enter into container sales contracts that include aluminum-based pricing terms that generally reflect the same price fluctuations under commercial purchase contracts for aluminum sheet. Second, we use certain derivative instruments, including option and forward contracts, as economic and cash flow hedges of commodity price risk where there are material differences between contracted sales and purchase pricing.
Considering the effects of derivative instruments, the company’s ability to pass-through certain raw material costs through contractual provisions, the market’s ability to accept price increases and the company’s commodity price exposures under its contract terms, a hypothetical 10 percent adverse change in the company’s aluminum prices would result in an estimated $3 million after-tax reduction in net earnings over a one-year period. Additionally, the company has currency exposures on raw materials and the effect of a 10 percent adverse change is included in the total currency exposure discussed below. Actual results may vary based on actual changes in market prices and rates and the timing of these changes.
Interest Rate Risk
Our objective in managing exposure to interest rate changes is to minimize the impact of interest rate changes on earnings and cash flows and to lower our overall borrowing costs. To achieve these objectives, we may use a variety of interest rate swaps, collars and options to manage our mix of floating and fixed-rate debt. Interest rate instruments held by the company at December 31, 2025, included pay-fixed interest rate swaps which effectively convert variable rate obligations to fixed-rate instruments.
Based on our interest rate exposure at December 31, 2025, assumed floating rate debt levels throughout the next 12 months and the effects of our existing derivative instruments, a 100-basis point increase in interest rates would result in an estimated $7 million after-tax reduction in net earnings over a one-year period. Actual results may vary based on actual changes in market prices and rates and the timing of these changes.
32
Currency Exchange Rate Risk
Our objective in managing exposure to currency fluctuations is to limit the exposure of cash flows and earnings from changes associated with currency exchange rate changes through the use of various derivative contracts. In addition, at times Ball manages earnings translation volatility through the use of currency option strategies, and the change in the fair value of those options is recorded in the company’s net earnings. Our currency translation risk results from the currencies in which we transact business. The company faces currency exposures in our global operations as a result of various factors including intercompany currency denominated loans, selling our products in various currencies, purchasing raw materials and equipment in various currencies and tax exposures not denominated in the functional currency of the entity with the exposure. Sales contracts are negotiated with customers to reflect cost changes and, where there is not an exchange pass-through arrangement, the company may use derivative instruments to manage significant currency exposures.
Considering the company’s derivative financial instruments outstanding at December 31, 2025, and the various currency exposures, a hypothetical 10 percent reduction (U.S. dollar strengthening) in currency exchange rates compared to the U.S. dollar would result in an estimated $15 million after-tax reduction in net earnings over a one-year period. A hypothetical 10 percent adverse change in the U.S. dollar’s currency exchange rates would increase our forecasted average debt balance by approximately $164 million. Actual results may vary based on actual changes in market prices and rates and the timing of these changes.
Net Investments in Foreign Operations Risk
The company is exposed to changes in foreign currencies impacting its net investments held in foreign subsidiaries. The company’s objective in managing exposure to net investments in foreign operations is to limit the foreign exchange translation risk associated with its net investments in non-U.S. Dollar foreign entities. The company uses fixed-for-fixed cross currency swaps and designated foreign currency denominated debt instruments to achieve this objective. As of December 31, 2025, the company had three fixed-for-fixed cross currency swaps outstanding, with notional amounts totaling €1.05 billion. A hypothetical 10 percent adverse change in the related foreign currency exchange rate would result in an estimated $67 million after-tax currency translation adjustment loss in other comprehensive earnings (loss).
33
Item 8. Financial Statements and Supplementary Data
Report of Independent Registered Public Accounting Firm
To the Board of Directors and Shareholders of Ball Corporation
Opinions on the Financial Statements and Internal Control over Financial Reporting
We have audited the accompanying consolidated balance sheets of Ball Corporation and its subsidiaries (the "Company") as of December 31, 2025 and 2024, and the related consolidated statements of earnings, of comprehensive earnings (loss), of shareholders' equity and of cash flows for each of the three years in the period ended December 31, 2025, including the related notes (collectively referred to as the "consolidated financial statements"). We also have audited the Company's internal control over financial reporting as of December 31, 2025, based on criteria established in Internal Control - Integrated Framework (2013) issued by the Committee of Sponsoring Organizations of the Treadway Commission (COSO).
In our opinion, the consolidated financial statements referred to above present fairly, in all material respects, the financial position of the Company as of December 31, 2025 and 2024, and the results of its operations and its cash flows for each of the three years in the period ended December 31, 2025 in conformity with accounting principles generally accepted in the United States of America. Also in our opinion, the Company maintained, in all material respects, effective internal control over financial reporting as of December 31, 2025, based on criteria established in Internal Control - Integrated Framework (2013) issued by the COSO.
Basis for Opinions
The Company's management is responsible for these consolidated financial statements, for maintaining effective internal control over financial reporting, and for its assessment of the effectiveness of internal control over financial reporting, included in Management’s Report on Internal Control Over Financial Reporting appearing under Item 9A. Our responsibility is to express opinions on the Company’s consolidated financial statements and on the Company's internal control over financial reporting based on our audits. We are a public accounting firm registered with the Public Company Accounting Oversight Board (United States) (PCAOB) and are required to be independent with respect to the Company in accordance with the U.S. federal securities laws and the applicable rules and regulations of the Securities and Exchange Commission and the PCAOB.
We conducted our audits in accordance with the standards of the PCAOB. Those standards require that we plan and perform the audits to obtain reasonable assurance about whether the consolidated financial statements are free of material misstatement, whether due to error or fraud, and whether effective internal control over financial reporting was maintained in all material respects.
Our audits of the consolidated financial statements included performing procedures to assess the risks of material misstatement of the consolidated financial statements, whether due to error or fraud, and performing procedures that respond to those risks. Such procedures included examining, on a test basis, evidence regarding the amounts and disclosures in the consolidated financial statements. Our audits also included evaluating the accounting principles used and significant estimates made by management, as well as evaluating the overall presentation of the consolidated financial statements. Our audit of internal control over financial reporting included obtaining an understanding of internal control over financial reporting, assessing the risk that a material weakness exists, and testing and evaluating the design and operating effectiveness of internal control based on the assessed risk. Our audits also included performing such other procedures as we considered necessary in the circumstances. We believe that our audits provide a reasonable basis for our opinions.
Definition and Limitations of Internal Control over Financial Reporting
A company’s internal control over financial reporting is a process designed to provide reasonable assurance regarding the reliability of financial reporting and the preparation of financial statements for external purposes in accordance with generally accepted accounting principles. A company’s internal control over financial reporting includes those policies and procedures that (i) pertain to the maintenance of records that, in reasonable detail, accurately and fairly reflect the transactions and dispositions of the assets of the company; (ii) provide reasonable assurance that transactions are recorded as necessary to permit preparation of financial statements in accordance with generally accepted accounting principles, and that receipts and expenditures of the company are being made only in accordance with authorizations of
34
management and directors of the company; and (iii) provide reasonable assurance regarding prevention or timely detection of unauthorized acquisition, use, or disposition of the company’s assets that could have a material effect on the financial statements.
Because of its inherent limitations, internal control over financial reporting may not prevent or detect misstatements. Also, projections of any evaluation of effectiveness to future periods are subject to the risk that controls may become inadequate because of changes in conditions, or that the degree of compliance with the policies or procedures may deteriorate.
Critical Audit Matters
The critical audit matter communicated below is a matter arising from the current period audit of the consolidated financial statements that was communicated or required to be communicated to the audit committee and that (i) relates to accounts or disclosures that are material to the consolidated financial statements and (ii) involved our especially challenging, subjective, or complex judgments. The communication of critical audit matters does not alter in any way our opinion on the consolidated financial statements, taken as a whole, and we are not, by communicating the critical audit matter below, providing a separate opinion on the critical audit matter or on the accounts or disclosures to which it relates.
Revenue Recognition from Certain Product Revenue
As described in Note 1 to the consolidated financial statements, the Company recognizes sales of packaging products when a customer obtains control of promised goods or services, which occurs either over time or at a point in time. Performance obligations for products with no alternative use are recognized over time when the Company has manufactured a unique item and has an enforceable right to payment. Generic products with an alternative use are recognized at a point in time. For all contracts, the transaction price is determined upon establishment of the contract that contains the final terms of the sale, including the description, quantity, and price of each product or service purchased. The Company’s consolidated net sales were $13.16 billion for the year ended December 31, 2025, of which a majority relates to certain product revenue.
The principal consideration for our determination that performing procedures relating to revenue recognition from certain product revenue is a critical audit matter is a high degree of auditor effort in performing procedures related to the Company’s revenue recognition from certain product revenue.
Addressing the matter involved performing procedures and evaluating audit evidence in connection with forming our overall opinion on the consolidated financial statements. These procedures included testing the effectiveness of controls relating to the revenue recognition process, including controls over the recognition of certain product revenue at the transaction price once the Company satisfies a performance obligation. These procedures also included, among others (i) testing a sample of revenue transactions by obtaining and inspecting source documents, such as customer contracts, invoices, proof of shipment, and payment receipts, and where sales incentives are applicable, support for the nature of the incentive, amount, and agreement with the customer and (ii) confirming a sample of outstanding customer invoice balances as of December 31, 2025 and, for confirmations not returned, obtaining and inspecting source documents, such as customer contracts, invoices, proof of shipment, and subsequent payment receipts.
/s/
February 19, 2026
We have served as the Company’s auditor since at least 1962. We have not been able to determine the specific year we began serving as auditor of the Company.
35
Consolidated Statements of Earnings
Ball Corporation
Years Ended December 31, | |||||||||
($ in millions, except per share amounts) | 2025 | 2024 | 2023 | ||||||
Net sales | $ | | $ | | $ | | |||
Cost of sales (excluding depreciation and amortization) | ( | ( | ( | ||||||
Depreciation and amortization | ( | ( | ( | ||||||
Selling, general and administrative | ( | ( | ( | ||||||
Business consolidation and other activities | | ( | ( | ||||||
Interest income | | | | ||||||
Interest expense | ( | ( | ( | ||||||
Debt refinancing and other costs | ( | ( | — | ||||||
Earnings before taxes | | | | ||||||
Tax (provision) benefit | ( | ( | ( | ||||||
Equity in results of affiliates, net of tax | | | | ||||||
Earnings from continuing operations | | | | ||||||
Discontinued operations, net of tax | — | | | ||||||
Net earnings | | | | ||||||
Net earnings attributable to noncontrolling interests | | | | ||||||
Net earnings attributable to Ball Corporation | $ | | $ | | $ | | |||
Earnings per share: | |||||||||
Basic - continuing operations | $ | | $ | | $ | | |||
Basic - discontinued operations | - | | | ||||||
Total basic earnings per share | $ | | $ | | $ | | |||
Diluted - continuing operations | $ | | $ | | $ | | |||
Diluted - discontinued operations | — | | | ||||||
Total diluted earnings per share | $ | | $ | | $ | | |||
Weighted average shares outstanding: (000s) | |||||||||
Basic | | | | ||||||
Diluted | | | | ||||||
The accompanying notes are an integral part of the consolidated financial statements.
36
Consolidated Statements of Comprehensive Earnings (Loss)
Ball Corporation
Years Ended December 31, | |||||||||
($ in millions) | 2025 | 2024 | 2023 | ||||||
Net earnings | $ | | $ | | $ | | |||
Other comprehensive earnings (loss): | |||||||||
Currency translation adjustment | | ( | | ||||||
Pension and other postretirement benefits | ( | | ( | ||||||
Derivatives designated as hedges | | | | ||||||
Total other comprehensive earnings (loss) | | ( | ( | ||||||
Tax (provision) benefit | | ( | | ||||||
Total other comprehensive earnings (loss), net of tax | | ( | ( | ||||||
Total comprehensive earnings | | | | ||||||
Comprehensive earnings attributable to noncontrolling interests | | | | ||||||
Comprehensive earnings attributable to Ball Corporation | $ | | $ | | $ | | |||
The accompanying notes are an integral part of the consolidated financial statements.
37
Consolidated Balance Sheets
Ball Corporation
December 31, | ||||||
($ in millions) | | 2025 | | 2024 | ||
Assets | ||||||
Current assets | ||||||
Cash and cash equivalents | $ | | $ | | ||
Receivables, net | | | ||||
Inventories, net | | | ||||
Other current assets | | | ||||
Current assets held for sale | | | ||||
Total current assets | | | ||||
Noncurrent assets | ||||||
Property, plant and equipment, net | | | ||||
Goodwill | | | ||||
Intangible assets, net | | | ||||
Other assets | | | ||||
Total assets | $ | | $ | | ||
Liabilities and Equity | ||||||
Current liabilities | ||||||
Short-term debt and current portion of long-term debt | $ | | $ | | ||
Accounts payable | | | ||||
Accrued employee costs | | | ||||
Other current liabilities | | | ||||
Current liabilities held for sale | — | | ||||
Total current liabilities | | | ||||
Noncurrent liabilities | ||||||
Long-term debt | | | ||||
Employee benefit obligations | | | ||||
Deferred taxes | | | ||||
Other liabilities | | | ||||
Total liabilities | | | ||||
Equity | ||||||
Common stock ( | | | ||||
Retained earnings | | | ||||
Accumulated other comprehensive earnings (loss) | ( | ( | ||||
Treasury stock, at cost ( | ( | ( | ||||
Total Ball Corporation shareholders' equity | | | ||||
Noncontrolling interests | — | | ||||
Total equity | | | ||||
Total liabilities and equity | $ | | $ | | ||
The accompanying notes are an integral part of the consolidated financial statements.
38
Consolidated Statements of Cash Flows
Ball Corporation
Years Ended December 31, | |||||||||
($ in millions) | 2025 | 2024 | 2023 | ||||||
Cash Flows from Operating Activities | |||||||||
Net earnings | $ | | $ | | $ | | |||
Adjustments to reconcile net earnings to cash provided by (used in) operating activities: | |||||||||
Depreciation and amortization | | | | ||||||
Business consolidation and other activities | ( | | | ||||||
Deferred tax provision (benefit) | | | ( | ||||||
Gain on Aerospace disposal | | ( | | ||||||
Pension contributions | ( | ( | ( | ||||||
Other, net | ( | | | ||||||
Working capital changes, excluding effects of acquisitions and dispositions: | |||||||||
Receivables | ( | ( | | ||||||
Inventories | ( | ( | | ||||||
Other current assets | | ( | ( | ||||||
Accounts payable | | ( | ( | ||||||
Accrued employee costs | ( | | | ||||||
Other current liabilities | ( | ( | ( | ||||||
Other, net | ( | | | ||||||
Cash provided by (used in) operating activities | | | | ||||||
Cash Flows from Investing Activities | |||||||||
Capital expenditures | ( | ( | ( | ||||||
Business acquisitions, net of cash acquired | ( | ( | — | ||||||
Business dispositions, net of cash sold | | | — | ||||||
Derivative settlements | ( | | | ||||||
Other, net | | | ( | ||||||
Cash provided by (used in) investing activities | ( | | ( | ||||||
Cash Flows from Financing Activities | |||||||||
Long-term borrowings | | | | ||||||
Repayments of long-term borrowings | ( | ( | ( | ||||||
Net change in short-term borrowings | ( | ( | ( | ||||||
Acquisitions of treasury stock | ( | ( | ( | ||||||
Common stock dividends | ( | ( | ( | ||||||
Other, net | ( | | | ||||||
Cash provided by (used in) financing activities | ( | ( | ( | ||||||
Effect of exchange rate changes on cash | | ( | | ||||||
Change in cash, cash equivalents and restricted cash | | | | ||||||
Cash, cash equivalents and restricted cash – beginning of year | | | | ||||||
Cash, cash equivalents and restricted cash – end of year (a) | $ | | $ | | $ | | |||
| (a) |
The accompanying notes are an integral part of the consolidated financial statements.
39
Consolidated Statements of Shareholders’ Equity
Ball Corporation
Ball Corporation and Subsidiaries | ||||||||||||||||||||||
Common Stock | Treasury Stock | Accumulated Other | ||||||||||||||||||||
Number of | Number of | Retained | Comprehensive | Noncontrolling | Total | |||||||||||||||||
($ in millions; share amounts in thousands) | | Shares | | Amount | | Shares | | Amount | | Earnings | | Earnings (Loss) | | Interest | | Equity | ||||||
Balance at December 31, 2022 | | | ( | ( | | ( | | | ||||||||||||||
Net earnings | — | — | — | — | | — | | | ||||||||||||||
Other comprehensive earnings (loss), net of tax | — | — | — | — | — | ( | — | ( | ||||||||||||||
Common dividends, net of tax benefits | — | — | — | — | ( | — | — | ( | ||||||||||||||
Treasury stock purchases | — | — | ( | ( | — | — | — | ( | ||||||||||||||
Treasury shares reissued | — | — | | | — | — | — | | ||||||||||||||
Shares issued and stock-based compensation, net of shares exchanged | | | — | — | — | — | — | | ||||||||||||||
Dividends paid to noncontrolling interest | — | — | — | — | — | — | ( | ( | ||||||||||||||
Other activity | — | — | — | | ( | — | — | | ||||||||||||||
Balance at December 31, 2023 | | | ( | ( | | ( | | | ||||||||||||||
Net earnings | — | — | — | — | | — | | | ||||||||||||||
Other comprehensive earnings (loss), net of tax | — | — | — | — | — | ( | — | ( | ||||||||||||||
Common dividends | — | — | — | — | ( | — | — | ( | ||||||||||||||
Treasury stock purchases | — | — | ( | ( | — | — | — | ( | ||||||||||||||
Treasury shares reissued | — | — | | | — | — | — | | ||||||||||||||
Shares issued and stock-based compensation, net of shares exchanged | | | — | — | — | — | — | | ||||||||||||||
Dividends paid to noncontrolling interest | — | — | — | — | — | — | ( | ( | ||||||||||||||
Other activity | — | — | — | | — | — | — | | ||||||||||||||
Balance at December 31, 2024 | | | ( | ( | | ( | | | ||||||||||||||
Net earnings | — | — | — | — | | — | | | ||||||||||||||
Other comprehensive earnings (loss), net of tax | — | — | — | — | — | | — | | ||||||||||||||
Common dividends | — | — | — | — | ( | — | — | ( | ||||||||||||||
Treasury stock purchases | — | — | ( | ( | — | — | — | ( | ||||||||||||||
Treasury shares reissued | — | — | | | — | — | — | | ||||||||||||||
Shares issued and stock-based compensation, net of shares exchanged | | | — | — | — | — | — | | ||||||||||||||
Business dispositions | — | — | — | — | — | — | ( | ( | ||||||||||||||
Distributions from deferred compensation plans and other activity | — | — | — | | — | — | ( | | ||||||||||||||
Balance at December 31, 2025 | | $ | | ( | $ | ( | $ | | $ | ( | $ | — | $ | | ||||||||
The accompanying notes are an integral part of the consolidated financial statements.
40
1. Significant Accounting Policies
The preparation of Ball Corporation’s (collectively, Ball, the company, we or our) consolidated financial statements in conformity with accounting principles generally accepted in the United States of America (U.S. GAAP) requires Ball’s management to make estimates and assumptions that affect the reported amounts of assets and liabilities and disclosure of contingent liabilities at the date of the financial statements and reported amounts of revenues and expenses during the reporting periods. These estimates are based on historical experience and various assumptions believed to be reasonable under the circumstances. Ball’s management evaluates these estimates on an ongoing basis and adjusts or revises the estimates as circumstances change. As future events and their impacts cannot be determined with precision, actual results may differ from these estimates. In the opinion of management, the financial statements reflect all adjustments necessary to fairly present the results of the periods presented.
On February 16, 2024, the company completed the divestiture of its aerospace business. The transaction represents a strategic shift; therefore, the company’s consolidated financial statements reflect the aerospace business’ financial results as discontinued operations for all periods presented. The aerospace business was historically presented as a reportable segment. Effective as of the first quarter of 2024, the company reports its financial performance in
Unless otherwise specified, these notes to the consolidated financial statements reflect continuing operations only.
Principles of Consolidation and Basis of Presentation
The consolidated financial statements include the accounts of Ball, its consolidated subsidiaries, and variable interest entities in which the company is considered to be the primary beneficiary. Equity investments in which the company exercises significant influence but does not control are accounted for using the equity method of accounting. Investments in which the company neither exercises significant influence over the investee, nor control the investment, are accounted for using the measurement alternative for equity investments, and, as such, are measured at cost minus impairment, if any, and adjusted for observable price changes in orderly transactions for the identical or a similar investment. Intercompany transactions are eliminated in consolidation.
Reclassifications
Certain prior year amounts have been reclassified in order to conform to the current year presentation.
Cash and Cash Equivalents
Cash and cash equivalents include cash on hand and highly liquid investments with original maturities of three months or less.
Inventories
Inventories are stated at the lower of cost or net realizable value using either the first-in, first-out (FIFO) cost method of accounting or the average cost method. Inventory cost is calculated for each inventory component taking into consideration the appropriate cost factors, including fixed and variable overhead, material price volatility and production levels.
41
Recoverability of Goodwill
On an annual basis, in the fourth quarter, and at interim periods as circumstances require, the company performs a qualitative analysis to determine whether it is more likely than not that the fair value of a reporting unit exceeds its carrying amount, which includes an evaluation as to whether there have been significant changes to macro-economic factors related to the reporting unit. If the qualitative analysis is not conclusive that it is more likely than not that a reporting unit’s fair value exceeds its carrying amount, the company performs a quantitative impairment test to determine the fair value of the reporting unit and, if necessary, recognizes an impairment charge for the amount by which the carrying value exceeds the fair value.
When performing a quantitative analysis, the company estimates fair value for a reporting unit using market and income approach valuation methodologies. Under the income approach, fair value is estimated as the present value of estimated future cash flows of each reporting unit. The projected cash flows incorporate various assumptions related to weighted average cost of capital (WACC) and growth rates that are specific to each reporting unit, including assumptions relating to net sales growth rates, terminal growth rates and EBITDA (a non-U.S. GAAP measure defined by the company as earnings before interest expense, taxes, depreciation and amortization) margin. Under the market approach, the company uses available information regarding multiples used in recent market transactions involving a transfer of controlling interests as well as publicly available trading multiples based upon the enterprise value of companies in the packaging industry. The appropriate multiple is applied to the forecasted EBITDA of each reporting unit to estimate fair value.
Impairment of Long-Lived Assets
Ball reviews long-lived assets for impairment when circumstances indicate the carrying amount of an asset or asset group may not be recoverable based on the undiscounted future cash flows of the asset. The company reviews long-lived assets for impairment at the asset group level for which the lowest level of independent cash flows can be identified. If the carrying amount of asset group is determined not to be recoverable, a write-down to fair value is recorded. Fair values are determined based on quoted market values, discounted cash flows or with the assistance of external appraisals, as applicable.
Depreciation and Amortization
Property, plant and equipment are carried at the cost of acquisition or construction. Repairs and maintenance costs, including labor and material costs for major improvements such as annual production line overhauls, are expensed as incurred, unless those costs substantially increase the useful lives or capacity of the existing assets. Assets are depreciated and amortized using the straight-line method over their estimated useful lives, generally
For certain business consolidation activities, accelerated depreciation may be required for the revised remaining useful life for assets designated to be scrapped or abandoned. The accelerated depreciation related to such activities is recorded as part of business consolidation and other activities in the appropriate period.
Environmental Reserves
The company estimates its liability for environmental matters based on, among other factors, the degree of probability of an unfavorable outcome and the ability to make a reasonable estimate of the amount of loss. The company records the best estimate of a loss when the loss is considered probable. As additional information becomes available, the company reassesses the potential liability related to pending matters and revises the estimates.
42
Revenue Recognition
The company recognizes sales of packaging products when a customer obtains control of promised goods or services, which occurs either over time or at a point in time.
At contract inception, the company assesses the goods and services promised in its contracts with customers and identifies a performance obligation for each promise to transfer goods or services to the customer. The performance obligation may be represented by a good or service (or a series of goods or services) that is distinct, or by a series of distinct goods or services that are substantially the same and have the same pattern of transfer to the customer. In each instance, the company treats the promise to transfer the customer goods or services as a single performance obligation.
To identify its performance obligations, the company considers all of the goods or services promised in the contract, regardless of whether they are explicitly stated or are implied by customary business practices.
The company has determined that the following distinct goods and services represent separate performance obligations:
| ● | Packaging products, which may be generic or unique; and |
| ● | Packaging lids and ends, which may be generic or unique. |
Performance obligations for products with no alternative use are recognized over time when the company has manufactured a unique item and has an enforceable right to payment, inclusive of profit. Conversely, generic products with an alternative use are recognized at a point in time. Contracts may be short-term or long-term, with varying payment terms. Ball’s payment terms vary by the type and location of the customer and the products or services offered. Customers pay in accordance with negotiated terms, which are typically triggered upon ownership transfer. All payment terms are less than
Ball typically enters into master agreements with customers, which establish the terms and conditions for subsequent orders of goods. In the context of the revenue recognition standard, enforceable contracts are those that have an enforceable right to payment, which Ball typically has once a binding forecast or purchase order (or similar evidence) is in place and Ball produces under the contract. These enforceable contracts typically have a duration of less than one year. Contracts that have an original duration of less than
Performance obligations are recognized both over time and at a point in time. The determination that sales should be recognized at a point in time most often results from the existence of an alternative use for the product. Cans and ends that are not customized for a customer prior to delivery are considered to have an alternative use, and sales are recognized at the point of control transfer. Determining when control transfer occurs may require management to make judgments that affect the timing of when sales are recognized. The revenue accounting standard provides five indicators that a customer has obtained control of an asset: 1) present right to payment; 2) transfer of legal title; 3) physical possession; 4) significant risks and rewards of ownership; and 5) customer acceptance. The company considers control to have transferred for these products upon shipment or delivery, depending on the legal terms of the contract, because the company has a present right to payment at that time, the customer has legal title to the asset, the company has transferred physical possession of the asset and/or the customer has significant risks and rewards of ownership of the asset. The company determines that control transfers to a customer as described above and provides a faithful depiction of the transfer of goods.
43
For performance obligations related to products that are unique with no alternative use (e.g., specialized sizes or customer-specific materials, or labeled with customer-specific artwork), the company transfers control and records sales over time. The recognition of sales occurs over time as goods are manufactured and Ball has an enforceable right to payment for those goods, which is an output method. Determining a measure of progress may require management to make judgments that impact the timing of when sales are recognized. The company has determined the above provides a faithful depiction of the transfer of goods to the customer. The number of units manufactured that have an enforceable right to payment is the best measure of depicting the company’s performance as control is transferred. The customer obtains value as each unit is produced against a binding contract.
The enforceable right to payment may be explicit or implied in the contract. If the enforceable right to payment is not explicit in the contract, Ball must consider if there is an implied right based on customer relationships or previous business practices and applicable law. Typically, Ball has an enforceable right to payment of costs plus a reasonable margin once a binding forecast or purchase order (or similar evidence) is in place and Ball produces under the contract.
In making its determination of stand-alone selling price, Ball maximizes its use of observable inputs. Stand-alone selling price is then used to allocate total consideration proportionally to the various performance obligations within a contract.
To estimate variable consideration, the company may apply both the “expected value” method and “most likely amount” method based on the form of variable consideration, after considering which method would provide the best prediction of consideration to be received from the company’s customers. The expected value method involves a probability-weighted determination of the expected amount, whereas the most likely amount method identifies the single most likely outcome in a range of possible amounts. In certain cases, both methods may be used within a single contract if multiple forms of variable consideration exist. However, once a method has been applied to one form of variable consideration, it is applied consistently throughout the contract term.
The primary types of variable consideration present in the company’s contracts are per-unit price changes, volume discounts and rebates. Once variable consideration has been estimated, it will be constrained if a significant reversal of the cumulative amounts of sales is probable in the context of the contract.
Revenue Contract Costs
The company has determined there are no material costs that meet the capitalization criteria for costs to obtain or fulfill a contract.
Revenue Recognition Practical Expedients
For contracts that have an original duration of one year or less, the company has elected the practical expedient applicable to such contracts and has not disclosed the transaction price for
The company has also elected the sales tax practical expedient; therefore, sales and other taxes assessed by a governmental authority that are collected concurrent with revenue-producing activities are excluded from the transaction price.
For shipping and handling activities performed after a customer obtains control of the goods, the company has elected to account for these costs as activities to fulfill the promise to transfer the goods; therefore, these activities are not assessed as separate performance obligations.
The company has also elected the significant
44
Disaggregation of Sales
The company disaggregates net sales by reportable segments, as disclosed in Note 3, and based on the timing of transfer of control for goods and services, as disclosed in Note 5. The transfer of control for goods and services may occur at a point in time or over time; in other words, sales may be recognized over the course of the underlying contract, or they may occur at a single point in time based upon the transfer of control. The company determined that disaggregating sales into these categories achieves the disclosure objective to depict how the nature, amount, timing and uncertainty of sales and cash flows are affected by economic factors. The company’s business consists of
Revenue Contract Balances
The company enters into contracts to sell packaging products. The payment terms and conditions in customer contracts vary. Those customers that prepay are represented by the contract liabilities shown in Note 5, until the company’s performance obligations are satisfied. Contract assets would exist when sales have been recorded (i.e., control of the goods or services has been transferred to the customer) but customer payment is contingent on a future event beyond the passage of time (i.e., satisfaction of additional performance obligations). Unbilled receivables, which are not classified as contract assets, represent arrangements in which sales have been recorded prior to billing and right to payment is unconditional.
Leases
The company enters into operating leases, the accounting guidance for which requires a lessee to recognize a right-of-use (ROU) asset and a lease liability. The guidance also requires a lessee to recognize a single lease cost, calculated so that the cost of the lease is allocated over the lease term, generally on a straight line basis.
A contract is a lease or contains one when (1) the contract contains an explicitly or implicitly identified asset and (2) the customer obtains substantially all of the economic benefits from the use of that underlying asset and directs how and for what purpose the asset is used during the term of the contract in exchange for consideration. The company assesses whether an arrangement is a lease, or contains a lease, upon inception of the contract.
The company enters into operating leases for buildings, warehouses, office equipment, production equipment, land and other types of equipment. When readily determinable, the discount rate used to calculate the lease liability is the rate implicit in the lease. Otherwise, the company uses its incremental borrowing rate based on the information available at lease commencement. The company’s finance and short-term leases are immaterial.
Many of the company’s leases include one or more renewal and/or termination options at the company’s discretion, which are included in the determination of the lease term if the company is reasonably certain to exercise the option. The company also enters into lease agreements that have variable payments, such as those related to usage or adjustments to certain indexes. Variable lease payments are recognized in the period in which those payments are incurred.
The company subleases all or portions of certain building and warehouse leases to third parties, all of which are classified as operating leases. Some of these arrangements offer the lessee renewal options.
45
Fair Value Measurements
Generally accepted accounting principles define fair value as the price that would be received to sell an asset or be paid to transfer a liability in an orderly transaction between market participants at the measurement date (exit price) and such principles also establish a fair value hierarchy that prioritizes the inputs used to measure fair value using the following definitions (from highest to lowest priority):
| ● | Level 1 – Unadjusted quoted prices in active markets that are accessible at the measurement date for identical, unrestricted assets or liabilities. |
| ● | Level 2 – Observable inputs other than quoted prices included within Level 1 that are observable for the asset or liability, either directly or indirectly, including quoted prices for similar assets and liabilities in active markets; quoted prices for identical or similar assets and liabilities in markets that are not active; or other inputs that are observable or can be corroborated by observable market data by correlation or other means. |
| ● | Level 3 – Prices or valuation techniques requiring inputs that are both significant to the fair value measurement and unobservable. |
Acquisitions
The company records acquisitions resulting in the consolidation of an enterprise using the purchase method of accounting. Under this method, the acquiring company records the assets acquired, including intangible assets that can be identified and named, and liabilities assumed based on their estimated fair values at the date of acquisition. The purchase price in excess of the fair value of the assets acquired and liabilities assumed is recorded as goodwill. If the assets acquired, net of liabilities assumed, are greater than the purchase price paid, then a bargain purchase has occurred and the company will recognize the gain immediately in earnings. Among other sources of relevant information, the company uses independent appraisals and actuarial or other valuations to assist in determining the estimated fair values of the assets and liabilities. Various assumptions are used in the determination of these estimated fair values including discount rates, market and volume growth rates, product selling prices, production costs and other prospective financial information. Transaction costs associated with acquisitions are expensed as incurred and included in the business consolidation and other activities line of the consolidated statements of earnings.
For acquisitions where the company acquires a controlling interest and previously owned an equity investment in the entity, the company will recognize in earnings, upon the completion of the acquisition, a gain or loss related to the company’s prior equity investment. This gain or loss is calculated based on the fair value of the equity investment as compared to the carrying value of the existing equity investment on the date of acquisition.
When the company purchases additional interests of consolidated subsidiaries, the difference between the fair value and carrying value of the noncontrolling interests acquired is accounted for in the common stock line within shareholders' equity.
46
Business Consolidation and Other Activities
The company estimates its liabilities for business closure activities by accumulating detailed estimates of costs and asset sale proceeds, if any, for each business consolidation initiative. This includes the estimated costs of employee severance, pension and related benefits; impairment of property and equipment and other assets, including estimates of net realizable value; accelerated depreciation; termination payments for contracts and leases; contractual obligations; and any other qualifying costs related to the exit plan, disposal or restructuring. These estimated costs are grouped by specific projects within the overall plans and are then monitored on a periodic basis. Such charges represent management’s best estimates, however, they require assumptions about the plans that may change over time. Changes in estimates for individual locations and other matters are evaluated periodically to determine if a change in estimate is required for the overall plan. Subsequent changes to the original estimates are included in current earnings and identified as business consolidation gains or losses.
Stock-Based Compensation
Ball has a variety of restricted stock, stock option, and stock-settled appreciation rights (SSARs) plans, and the related stock-based compensation is primarily reported as part of selling, general and administrative in the consolidated statements of earnings. The compensation expense associated with restricted stock grants is calculated using the fair value at the date of grant (closing stock price) and is amortized over the restriction period. For stock options and SSARs, the company has elected to use the Black-Scholes valuation model and amortizes the estimated fair value, determined at the date of grant, on a straight-line basis over the requisite service period (generally, the vesting period). The company’s deferred compensation stock program is subject to variable plan accounting and, accordingly, is valued at the closing price of the company’s common stock at the end of each reporting period.
Currency Translation
Assets and liabilities of non-U.S. operations with a functional currency other than the U.S. dollar are translated using period-end exchange rates, and revenues and expenses are translated using average exchange rates during each period. Translation gains and losses are reported in accumulated other comprehensive earnings (loss) as a component of shareholders’ equity.
Income Taxes
Deferred income taxes reflect the future tax consequences of differences between the tax bases of assets and liabilities and their financial reporting amounts at each balance sheet date, based upon enacted income tax laws and tax rates. Income tax expense or benefit is provided based on earnings reported in the financial statements. The provision for income tax expense or benefit differs from the amounts of income taxes currently payable because certain items of income and expense included in the consolidated financial statements are recognized in different time periods by taxing authorities. At times, Ball may purchase transferable income tax credits that can be used to offset its current year or a prior year income tax liability. These credits are presented as an adjustment to income taxes payable within other current liabilities on the consolidated balance sheet, with any deferred credit reducing income tax expense in the year the credit is utilized.
47
Deferred tax assets, including operating loss, capital loss and tax credit carryforwards, are reduced by a valuation allowance when, in the opinion of management, it is more likely than not that any portion of these tax attributes will not be realized. In addition, from time to time, management must assess the need to accrue or disclose uncertain tax positions for proposed adjustments from various federal, state and non-U.S. tax authorities who regularly audit the company in the normal course of business. In making these assessments, management must often analyze complex tax laws of multiple jurisdictions, including many non-U.S. jurisdictions. The accounting guidance prescribes a recognition threshold and measurement attribute for the financial statement recognition and measurement of a tax position taken or expected to be taken in a tax return. The company records the related interest expense and penalties, if any, as tax expense in the tax provision.
Stranded taxes in accumulated other comprehensive earnings (loss) are reclassified to the consolidated statement of earnings when the activity that generated the deferred gains and losses has fully ceased.
Defined Benefit Pension Plans and Other Employee Benefits
The company has defined benefit plans and postretirement plans that provide certain medical benefits and life insurance for retirees and eligible dependents and, to a lesser extent, participates in multi-employer defined benefit plans for which Ball is not the sponsor. For the company-sponsored plans, the relevant accounting guidance requires that management make certain assumptions relating to the long-term rate of return on plan assets, discount rates used to determine the present value of future obligations and expenses, salary inflation rates, health care cost trend rates, mortality rates and other assumptions. The company believes the accounting estimates related to the company’s pension and postretirement plans are critical accounting estimates because they are highly susceptible to change from period to period based on the performance of plan assets, actuarial valuations, market conditions and contracted benefit changes. The selection of assumptions is based on historical trends and known economic and market conditions at the time of valuation, as well as independent studies of trends performed by the company’s actuaries. However, actual results may differ substantially from the estimates that were based on the critical assumptions.
The company recognizes the funded status of each defined benefit pension plan and other postretirement benefit plans on the consolidated balance sheet. Each overfunded plan is recognized as an asset, and each underfunded plan is recognized as a liability. Pension plan obligations are revalued annually, or when an event occurs that requires remeasurement, based on updated assumptions and information about the individuals covered by the plan. For pension plans, accumulated actuarial gains and losses in excess of a
Derivative Financial Instruments
The company uses derivative financial instruments for the purpose of hedging commercial risk exposures to fluctuations in commodity prices, interest rates, currency exchange rates, net investments in foreign operations and prices of the company’s common stock with regard to the company’s deferred compensation stock plan. The company’s derivative instruments are recorded on the consolidated balance sheets at fair value. The company values each derivative financial instrument either by using a single valuation technique based on observable market inputs performed internally or by obtaining valuation information from a reliable and observable market source. For a derivative designated as a cash flow hedge, the derivative's mark to fair value is initially recorded as a component of accumulated other comprehensive earnings (loss) and subsequently reclassified into earnings when the hedged item affects earnings, unless it is probable that the forecasted transaction will not occur. For net investment hedges, changes in fair value due to fluctuations in the spot rate are recorded to currency translation, net of tax, within accumulated other comprehensive earnings (AOCI). Gains and losses remain in AOCI until a sale or upon complete or substantially complete liquidation of the respective
48
underlying net investment in the foreign entity. The changes in fair value attributable to changes other than those due to fluctuations in the spot rate are excluded from the assessment of hedge effectiveness and are recorded as a reduction to interest expense over the life of the hedge in the consolidated statements of earnings. Derivatives that do not qualify for hedge accounting are marked to fair value with gains and losses immediately recorded in earnings. In the consolidated statements of cash flows, derivative activities are classified based on the cash flows of the items being hedged, except for those activities that are hedging the effect of exchange rate changes on cash, which are presented in investing activities, and the periodic interest cash settlements for net investment hedges, which are presented in operating activities.
Upon the dedesignation of an effective derivative contract, the gains or losses are deferred in accumulated other comprehensive earnings (loss) until the originally hedged item affects earnings unless it is probable the hedged item will not occur at which time it is recognized immediately. Any gains or losses incurred after the dedesignation date are recorded in earnings immediately.
Contingencies
The company is subject to various legal proceedings and claims, including those that arise in the ordinary course of business. The company records loss contingencies when it determines the outcome of the future event is probable of occurring and the amount of the loss can be reasonably estimated. Gain contingencies are recognized in the financial statements when they are realized or realizable.
The determination of a reserve for a loss contingency is based on management’s judgment of probability and estimates with respect to the likelihood of an outcome and valuation of the future event. Liabilities are recorded or adjusted when events or circumstances cause these judgments or estimates to change. In assessing whether a loss is probable, Ball may consider the following factors, among others: the nature of the litigation, claim or assessment; available information, opinions or views of legal counsel and other advisors; and the experience gained from similar cases by the company and others. The company provides disclosures for material contingencies when there is a reasonable possibility that a loss or an additional loss may be incurred.
2. Accounting Pronouncements
Recently Adopted Accounting Standards
Income Tax Disclosures
In 2023, new guidance was issued by the FASB with the goal of providing financial statement users with more information in the income tax rate reconciliation table and regarding income taxes paid. Ball adopted all required disclosures effective 2025, on a prospective basis, in Note 16.
49
New Accounting Guidance and Disclosure Requirements
Improvements to Accounting for Internal-Use Software
In 2025, new guidance was issued by the Financial Accounting Standards Board (FASB) with the goal to better align accounting with how internal-use software is developed. The company is assessing the impact that the adoption of this new guidance will have on its consolidated financial statements and expects to adopt the guidance on a prospective basis in 2028.
Measurement of Credit Losses for Accounts Receivable and Contract Assets
In 2025, amended guidance was issued by the FASB with the goal of improving efficiencies associated with the measurement of credit losses for accounts receivable and contract assets by allowing entities to elect a practical expedient for measurement. The company is assessing the impact that the adoption of this new guidance will have on its consolidated financial statements and expects to adopt the guidance on a prospective basis in 2026.
Disaggregation of Income Statement Expenses
In 2024, new guidance was issued by the FASB with the goal of providing financial statement users with more expense information of certain categories of expenses that are included in line items on the face of the statements of earnings. The company is assessing the impact that the adoption of this new guidance will have on its consolidated financial statements and expects to meet the disclosure requirements on a prospective basis in its 2027 annual report and interim periods thereafter.
3. Business Segment Information
Ball’s operations are organized and reviewed by management along its product lines and geographical areas and presented in the
Beverage packaging, North and Central America: Consists of operations in the U.S., Canada and Mexico that manufacture and sell aluminum beverage containers throughout those countries.
Beverage packaging, EMEA: Consists of operations in numerous countries throughout Europe, as well as Egypt and Turkey, that manufacture and sell aluminum beverage containers throughout those countries.
Beverage packaging, South America: Consists of operations in Brazil, Argentina, Paraguay and Chile that manufacture and sell aluminum beverage containers throughout most of South America.
50
As presented in the tables below, Other consists of a non-reportable operating segment (beverage packaging, other) that manufactures and sells aluminum beverage containers in India and Myanmar; a non-reportable operating segment that manufactures and sells extruded aluminum aerosol containers and recloseable aluminum bottles across multiple consumer categories as well as aluminum slugs (personal & home care) throughout North America, South America, and Europe; undistributed corporate expenses; and intercompany eliminations and other business activities.
On August 27, 2025, the company sold
On March 21, 2025, Ball closed on a transaction for its aluminum cups business, which resulted in Ball deconsolidating the business. The financial results of the aluminum cups business are presented in Other in the tables below through the date of the transaction and the assets and liabilities of the business were presented as current assets held for sale and current liabilities held for sale on the consolidated balance sheet as of December 31, 2024. See Note 4 for further details on the Saudi Arabia and aluminum cups businesses.
The accounting policies of the segments are the same as those used in the consolidated financial statements, as discussed in Note 1. The company also has investments in operations in Guatemala, Panama, the U.S., Vietnam and Saudi Arabia that are accounted for under the equity method of accounting and, accordingly, those results are not included in segment sales or earnings.
Ron Lewis, Chief Executive Officer, is the company’s chief operating decision maker (CODM). For each reportable segment, the CODM uses segment comparable operating earnings to analyze profitability compared to internal forecasts and comparative prior periods. These analyses allow the CODM to have constructive dialogue with other company leaders on how to improve company performance.
Major Customers
Net sales to major customers, as a percentage of consolidated net sales, were as follows:
| 2025 | | 2024 | | 2023 |
| |
Anheuser-Busch InBev and affiliates | | % | | % | | % | |
Coca-Cola Bottlers' Sales & Services Company LLC and affiliates | | % | | % | | % | |
Red Bull GmbH and affiliates | | % | | % | | % |
Summary of Net Sales by Geographic Area (a)
($ in millions) | | U.S. | Brazil | | Other | | Consolidated | |||||
2025 | $ | | $ | | $ | | $ | | ||||
2024 | | | | | ||||||||
2023 | | | | | ||||||||
| (a) | Revenue is attributed based on origin of sale and includes intercompany eliminations. |
51
Summary of Net Long-Lived Assets by Geographic Area (a)
($ in millions) | | U.S. | | Brazil | | Other | | Consolidated | ||||
As of December 31, 2025 | $ | | $ | | $ | | $ | | ||||
As of December 31, 2024 | | | | | ||||||||
| (a) | Long-lived assets exclude goodwill and intangible assets. |
Summary of Business by Segment
Years Ended December 31, | |||||||||
($ in millions) | 2025 | | 2024 | | 2023 | ||||
Net sales | |||||||||
Beverage packaging, North and Central America | $ | | $ | | $ | | |||
Beverage packaging, EMEA | | | | ||||||
Beverage packaging, South America | | | | ||||||
Reportable segment sales | | | | ||||||
Other | | | | ||||||
Net sales | $ | | $ | | $ | | |||
Comparable segment operating earnings (a) | |||||||||
Beverage packaging, North and Central America | $ | | $ | | $ | | |||
Beverage packaging, EMEA | | | | ||||||
Beverage packaging, South America | | | | ||||||
Reportable segment comparable operating earnings | | | | ||||||
Reconciling items | |||||||||
Other (b) | ( | ( | | ||||||
Business consolidation and other activities | | ( | ( | ||||||
Amortization of acquired intangibles | ( | ( | ( | ||||||
Interest expense | ( | ( | ( | ||||||
Debt refinancing and other costs | ( | ( | — | ||||||
Earnings before taxes | $ | | $ | | $ | | |||
| (a) | The difference between reportable segment net sales and comparable operating earnings is comprised of other segment items. Other segment items includes cost of sales, depreciation and amortization, selling, general and administrative and interest income amounts. The CODM does not receive or use these amounts at the reportable segment level. However, the CODM is provided these amounts at a consolidated level to manage operations. |
| (b) | Includes undistributed corporate expenses, net, of $ |
52
Years Ended December 31, | ||||||||||
($ in millions) | | 2025 | | 2024 | | 2023 | ||||
Depreciation and amortization (a) | ||||||||||
Beverage packaging, North and Central America | $ | | $ | | $ | | ||||
Beverage packaging, EMEA | | | | |||||||
Beverage packaging, South America | | | | |||||||
Reportable segment depreciation and amortization | | | | |||||||
Other | | | | |||||||
Depreciation and amortization | $ | | $ | | $ | | ||||
| (a) | Includes amortization of acquired Rexam intangibles. |
The company does not disclose total assets by segment as it is not provided to the CODM.
4. Acquisitions and Dispositions
Acquisition of Benepack European Production Facilities
In January 2026, the company acquired an
Saudi Arabia
On August 27, 2025, the company sold
Aluminum Cups
In the fourth quarter of 2024, Ball’s Board of Directors provided approval for the company to form a strategic partnership for the aluminum cups business in early 2025. As a result, Ball recorded a noncash impairment charge of $
On March 21, 2025, Ball and Ayna.AI LLC (Ayna) executed a Unit Purchase Agreement to form a strategic partnership in which Ball owns a
53
transaction in business consolidation and other activities in the consolidated statement of earnings for the year ended December 31, 2025.
Acquisition of Florida Can Manufacturing
In February 2025, the company closed on the acquisition of Florida Can Manufacturing for cash consideration of $
Personal & Home Care Acquisition of Alucan Entec
In October 2024, the company acquired the entire share capital of Alucan Entec, S.A, an impact extruded aluminum packaging business with a manufacturing facility in Lummen, Belgium and Llinars del Vallés, Spain, for the purchase price of $
Aerospace
In the third quarter of 2023, Ball entered into a Stock Purchase Agreement (Agreement) with BAE Systems, Inc. (BAE) and, for the limited purposes set forth therein, BAE Systems plc, to sell all outstanding equity interests in Ball’s aerospace business. On February 16, 2024, the company completed the divestiture of the aerospace business for a purchase price of $
The sale of the aerospace business represents a strategic shift that will have a major effect on Ball’s operations and financial results, including the removal of the aerospace reportable segment. Due to this shift, for all periods presented, the consolidated financial statements reflect the aerospace business’ financial results as discontinued operations in the consolidated statements of earnings. See Note 1 for further information on the basis of presentation.
54
The following table presents components of discontinued operations, net of tax for the years ended December 31, 2025, 2024 and 2023:
Years Ended December 31, | |||||||||
($ in millions) | 2025 | 2024 | 2023 | ||||||
Net sales | $ | — | $ | | $ | | |||
Cost of sales (excluding depreciation and amortization) | — | ( | ( | ||||||
Depreciation and amortization | — | ( | ( | ||||||
Selling, general and administrative | — | ( | ( | ||||||
Interest expense | — | — | | ||||||
Gain (loss) on disposition | ( | | ( | ||||||
Tax (provision) benefit | | ( | | ||||||
Discontinued operations, net of tax | $ | — | $ | | $ | | |||
The 2024 and 2023 effective income tax rates on discontinued operations were
The following table presents depreciation and amortization, capital expenditures and significant operating and investing noncash items from discontinued operations for the years ended December 31, 2025, 2024 and 2023 included within the consolidated statements of cash flows. Amounts include adjustments to reconcile net earnings to cash provided by (used in) operating activities:
Year Ended December 31, | |||||||||
($ in millions) | | 2025 | 2024 | 2023 | |||||
Provided by (used in) | |||||||||
Depreciation and amortization | $ | — | $ | | $ | | |||
Loss (gain) on Aerospace disposal | | ( | | ||||||
Capital expenditures | — | ( | ( | ||||||
Noncash investing activities include the acquisition of property, plant and equipment (PP&E) for which payment has not been made. These noncash capital expenditures are excluded from the consolidated statements of cash flows. A summary of the PP&E acquired but not yet paid for from discontinued operations is as follows:
Year Ended December 31, | |||||||||
($ in millions) | 2025 | 2024 | 2023 | ||||||
Supplemental cash flow information: | |||||||||
PP&E acquired but not yet paid | $ | — | $ | | $ | | |||
55
5. Revenue from Contracts with Customers
The following table disaggregates the company’s net sales based on the timing of transfer of control:
($ in millions) | Point in Time | Over Time | Total | ||||||
2025 | $ | | $ | | $ | | |||
2024 | | | | ||||||
2023 | | | | ||||||
The company did not have any contract assets at December 31, 2025, 2024, or 2023. The opening and closing balances of the company’s current and noncurrent contract liabilities are as follows:
Contract | Contract | |||||
Liabilities | Liabilities | |||||
($ in millions) | | (Current) | (Noncurrent) | |||
Balance at December 31, 2023 | $ | | | |||
Increase (decrease) | ( | ( | ||||
Balance at December 31, 2024 | $ | | $ | | ||
Increase (decrease) | | — | ||||
Balance at December 31, 2025 | $ | | $ | | ||
During the year ended December 31, 2025, contract liabilities increased by $
6. Business Consolidation and Other Activities
2025
During 2025, the company recorded income of $
2024
During 2024, the company recorded charges of $
56
2023
During 2023, the company recorded charges of $
7. Supplemental Cash Flow Statement and Other Disclosures
December 31, | ||||||
($ in millions) | 2025 | | 2024 | |||
| ||||||
Beginning of period: | | |||||
Cash and cash equivalents | $ | | | $ | | |
| | | ||||
Noncurrent restricted cash (included in other assets) | | | — | |||
Cash reported in current assets held for sale | | | — | |||
Total cash, cash equivalents and restricted cash | $ | | | $ | | |
| ||||||
End of period: | | |||||
Cash and cash equivalents | $ | | | $ | | |
| | | ||||
Noncurrent restricted cash (included in other assets) | | | ||||
Cash reported in current assets held for sale | — | | ||||
Total cash, cash equivalents and restricted cash | $ | | | $ | | |
The company’s current restricted cash is primarily related to receivables factoring programs and represents amounts collected from customers that have not yet been remitted to the banks as of the end of the reporting period. Restricted cash also relates to consideration owed for business acquisitions.
Noncash investing activities include the acquisition of property, plant and equipment (PP&E) for which payment has not been made. These noncash capital expenditures are excluded from the consolidated statements of cash flows. A summary of the PP&E acquired but not yet paid, inclusive of amounts related to the historical aerospace business, is as follows:
December 31, | ||||||
($ in millions) | 2025 | | 2024 | |||
| ||||||
Beginning of period: | | |||||
PP&E acquired but not yet paid | $ | | | $ | | |
End of period: | | |||||
PP&E acquired but not yet paid | $ | | | $ | | |
Supplier Finance Programs
The company has several regional supplier finance programs, all of which have substantially similar characteristics, with various financial institutions that act as the paying agent for certain payables of the company. The company establishes
57
these programs through agreements with the financial institutions to enable more efficient payment processing to our suppliers while also providing our suppliers a potential source of liquidity to the extent they enter into a factoring agreement with the financial institutions. Our suppliers’ participation in the programs is voluntary, and the company is not involved in negotiations of the suppliers’ arrangements with the financial institutions to sell their receivables, and our rights and obligations to our suppliers are not impacted by our suppliers’ decisions to sell amounts under these programs. Under these supplier finance programs, the company pays the financial institutions the stated amount of confirmed invoices from its participating suppliers on the original maturity dates of the invoices, which vary based on the negotiated terms with each supplier. All payment terms are short-term in nature and are not dependent on whether the suppliers participate in the supplier finance programs or if the suppliers elect to receive early payment from the financial institutions. Our supplier finance programs do not include any of the following: guarantees to the financial institutions, assets pledged as securities or interest accruing on the obligation prior to the due date.
A rollforward of the amount of obligations outstanding that the company confirmed as valid to the financial institutions under the company's programs follows:
December 31, | ||||||
($ in millions) | 2025 | 2024 | ||||
Obligations outstanding at the beginning of period | $ | | $ | | ||
Invoices confirmed during the period | | | ||||
Confirmed invoices paid during the period | ( | ( | ||||
Foreign exchange impacts | | $ | ( | |||
Obligations outstanding at the end of period | $ | | $ | | ||
The amounts above are classified within accounts payable on the consolidated balance sheets, and the associated payments are reflected in the cash flows from operating activities section of the consolidated statements of cash flows.
8. Receivables, Net
December 31, | ||||||
($ in millions) | 2025 | | 2024 | |||
Trade accounts receivable | $ | | $ | | ||
Unbilled receivables | | | ||||
Less: Allowance for doubtful accounts | ( | ( | ||||
Net trade accounts receivable | | | ||||
Other receivables | | | ||||
$ | | $ | | |||
The company has entered into several regional accounts receivable factoring programs with various financial institutions for certain receivables of the company. The programs are accounted for as true sales of the receivables, with limited recourse to Ball, and had combined limits of approximately $
Other receivables include income and indirect tax receivables, aluminum scrap sale receivables and other miscellaneous receivables.
58
9. Inventories, Net
December 31, | ||||||
($ in millions) | | 2025 | | 2024 | ||
Raw materials and supplies | $ | | $ | | ||
Finished goods | | | ||||
Less: Inventory reserves | ( | ( | ||||
$ | | $ | | |||
10. Property, Plant and Equipment, Net
December 31, | ||||||
($ in millions) | | 2025 | | 2024 | ||
Land | $ | | $ | | ||
Buildings | | | ||||
Machinery and equipment | | | ||||
Construction-in-progress | | | ||||
| | |||||
Accumulated depreciation | ( | ( | ||||
$ | | $ | | |||
Property, plant and equipment are stated at historical or acquired cost. Depreciation expense amounted to $
As discussed in Note 4, the assets of the aluminum cups and Saudi Arabian businesses were presented as current assets held for sale on the consolidated balance sheet at December 31, 2024. In 2024, Ball recorded a noncash impairment charge related to the long-lived assets of the aluminum cups business, of which $
11. Goodwill
($ in millions) | | Beverage | | Beverage | | Beverage | | Other | | Total | |||||
Balance at December 31, 2023 | $ | | $ | | $ | | $ | | $ | | |||||
Additions | — | — | — | | | ||||||||||
Effects of currency exchange | — | ( | — | ( | ( | ||||||||||
Other | — | — | | ( | ( | ||||||||||
Balance at December 31, 2024 | $ | | $ | | $ | | $ | | $ | | |||||
Additions | — | — | — | | | ||||||||||
Effects of currency exchange | — | | — | | | ||||||||||
Balance at December 31, 2025 | $ | | $ | | $ | | $ | | $ | | |||||
59
12. Intangible Assets, Net
December 31, | ||||||
($ in millions) | | 2025 | | 2024 | ||
Acquired customer relationships and other intangibles (net of accumulated amortization and impairment losses of $ | $ | | $ | | ||
Capitalized software (net of accumulated amortization of $ | | | ||||
Other intangibles (net of accumulated amortization of $ | | | ||||
$ | | $ | | |||
Total amortization expense of intangible assets was $
As discussed in Note 4, the assets of the Saudi Arabian business were presented as current assets held for sale on the consolidated balance sheet at December 31, 2024, of which $
13. Other Assets
December 31, | ||||||
($ in millions) | | 2025 | | 2024 | ||
Long-term pension assets | $ | | $ | | ||
| | |||||
Investments in affiliates | | | ||||
Long-term deferred tax assets | | | ||||
Other | | | ||||
$ | | $ | | |||
Investments in affiliates primarily includes the company’s
In September and December 2025, Ball acquired $
60
See Note 14, Note 16 and Note 17 for further details related to the company’s long-term right-of-use operating lease assets, deferred tax assets and pension assets, respectively.
14. Leases
The components of lease expense were as follows:
December 31, | |||||
($ in millions) | 2025 | | 2024 | ||
Operating lease expense | $ | ( | $ | ( | |
Financing lease expense | ( | ( | |||
Variable lease expense | ( | ( | |||
Sublease income | | | |||
Net lease expense | $ | ( | $ | ( | |
Supplemental cash flow information related to leases was as follows:
December 31, | |||||
($ in millions) | 2025 | | 2024 | ||
Cash paid for amounts included in the measurements of lease liabilities: | |||||
Operating cash outflows for operating leases | $ | ( | $ | ( | |
Financing cash outflows for finance leases | ( | ( | |||
ROU assets obtained in exchange for: | |||||
Operating lease obligations | | | |||
Finance lease obligations | | | |||
Supplemental balance sheet information related to leases was as follows:
December 31, | |||||||
($ in millions) | Balance Sheet Location | 2025 | 2024 | ||||
Operating leases: | |||||||
Operating lease ROU asset | $ | | $ | | |||
Current operating lease liabilities | | | |||||
Noncurrent operating lease liabilities | | | |||||
Finance leases: | |||||||
Finance lease ROU assets, net | | | |||||
Current finance lease liabilities | Short-term debt and current portion of long-term debt | | | ||||
Noncurrent finance lease liabilities | | | |||||
61
Weighted average remaining lease term and weighted average discount rate for the company’s leases were as follows:
December 31, | |||||||
2025 | 2024 | ||||||
Weighted average remaining lease term in years: | |||||||
Operating leases | |||||||
Finance leases | |||||||
Weighted average discount rate: | |||||||
Operating leases | | % | | % | |||
Finance leases | | % | | % | |||
Maturities of lease liabilities are as follows:
($ in millions) | Operating Leases | Finance Leases | ||||
2026 | $ | | $ | | ||
2027 | | | ||||
2028 | | | ||||
2029 | | | ||||
2030 | | | ||||
Thereafter | | | ||||
Future value of lease liabilities | | | ||||
Less: Imputed interest | ( | — | ||||
Present value of lease liabilities | $ | | $ | | ||
62
15. Debt and Interest Costs
Long-term debt outstanding and interest rates in effect, along with short-term debt outstanding, consisted of the following:
December 31, | ||||||
($ in millions) | | 2025 | | 2024 | ||
Senior Notes | ||||||
$ | — | $ | | |||
— | | |||||
| | |||||
— | | |||||
| | |||||
| | |||||
| | |||||
| — | |||||
| — | |||||
Senior Credit Facility (at variable rates) | ||||||
U.S. dollar revolver due June 2030 | — | — | ||||
Multi-currency revolver due June 2030 | — | — | ||||
Term A loan due June 2027 ( | — | | ||||
Term A loan due November 2030 ( | | — | ||||
| | |||||
Other (including debt issuance costs) | ( | ( | ||||
| | |||||
Less: Current portion of long-term debt | ( | ( | ||||
Long-term debt | $ | | $ | | ||
Short-term debt | ||||||
Current portion of long-term debt | $ | | $ | | ||
— | | |||||
Short-term committed loans | — | | ||||
Short-term uncommitted credit facilities | | | ||||
Short-term debt and current portion of long-term debt | $ | | $ | | ||
On November 25, 2025, Ball refinanced its existing senior credit facilities that were previously amended in 2022, which included redeeming the outstanding obligation of $
On November 17, 2025, Ball redeemed all of the outstanding principal of its $
63
In August 2025, Ball issued $
In July 2025, Ball repaid at maturity the outstanding
In May 2025, Ball issued €
On February 14, 2024, Ball announced a public tender of the $
The fair value of Ball’s long-term debt was estimated to be $
Maturities of long-term debt obligations outstanding at December 31, 2025, are as follows:
($ in millions) | |||
2026 | $ | | |
2027 | | ||
2028 | | ||
2029 | | ||
2030 | | ||
Thereafter | | ||
Total long-term debt obligations | | ||
Other (including debt issuance costs) | ( | ||
Less: Current portion of long-term debt | ( | ||
Long-term debt | $ | | |
Letters of credit outstanding at December 31, 2025 and 2024, were $
Interest expense and debt refinancing and other costs were $
64
The company’s senior notes and senior credit facilities are guaranteed on a full and unconditional, joint and several basis by certain of its material subsidiaries. Each of the guarantor subsidiaries is
The U.S. note agreements and bank credit agreement contain certain restrictions relating to dividend payments, share repurchases, investments, financial ratios, guarantees and the incurrence of additional indebtedness. The company’s most restrictive debt covenant requires it to maintain a leverage ratio (as defined) of no greater than
16. Taxes on Income
The amount of earnings before income taxes is:
Years Ended December 31, | ||||||||||
($ in millions) | | 2025 | | 2024 | | 2023 | ||||
U.S. | $ | | $ | ( | $ | | ||||
Non-U.S. | | | | |||||||
$ | | $ | | $ | | |||||
The provision (benefit) for income tax expense is:
Years Ended December 31, | |||||||||
($ in millions) | | 2025 | | 2024 | | 2023 | |||
Current | |||||||||
U.S. | $ | | $ | | $ | ( | |||
State and local | | ( | | ||||||
Non-U.S. | | | | ||||||
Total current | | | | ||||||
Deferred | |||||||||
U.S. | | | ( | ||||||
State and local | | ( | | ||||||
Non-U.S. | | ( | | ||||||
Total deferred | | ( | ( | ||||||
Tax provision (benefit) | $ | | $ | | $ | | |||
65
The following table is a reconciliation of the U.S. federal statutory rate of
Year Ended December 31, | ||||||
2025 | ||||||
($ in millions) | | Amount | | Percent | ||
U.S. federal statutory tax rate | $ | | | % | ||
State and local income taxes, net of federal income tax effect (a) | | | ||||
Foreign tax effects: | ||||||
Brazil: | ||||||
Effect of currency exchange gains and losses | | | ||||
Tax holidays | ( | ( | ||||
Other | | | ||||
Mexico: | ||||||
Effect of currency exchange gains and losses | ( | ( | ||||
Other | | | ||||
Netherlands: | ||||||
Sale of the Saudi Arabian business | ( | ( | ||||
Other | | | ||||
Other foreign jurisdictions | | | ||||
Tax credits | ( | ( | ||||
Other adjustments | | | ||||
Total tax provision and effective tax rate | $ | | | % | ||
| (a) | The states that contribute to the majority (greater than 50 percent of the tax effect in this category) include California, Pennsylvania, Maryland, Alabama, Tennessee, Texas and Colorado for 2025. |
The income tax provision recorded within the consolidated statements of earnings differs from the provision determined by applying the U.S. statutory tax rate to pretax earnings as a result of the following presented in accordance with the guidance prior to the adoption of the new income tax disclosures:
Years Ended December 31, | |||||||
($ in millions) | | 2024 | | 2023 | |||
Statutory U.S. federal income tax | $ | | $ | | |||
Increase (decrease) due to: | |||||||
Non-U.S. tax rate differences including tax holidays | | ( | |||||
Non-U.S. tax law and rate changes | | | |||||
Currency exchange (gain) loss on revaluation of deferred tax balances | | ( | |||||
Global intangible low-taxed income (GILTI) | | | |||||
U.S. state and local taxes, net | ( | | |||||
U.S. taxes on non-U.S. earnings, net of tax deductions and credits | ( | ( | |||||
Uncertain tax positions, including interest | ( | ( | |||||
Change in valuation allowances | ( | | |||||
Equity compensation related impacts | ( | ( | |||||
Other, net | ( | ( | |||||
Provision (benefit) for taxes | $ | | $ | | |||
Effective tax rate expressed as a percentage of pretax earnings | | % | | % | |||
66
The company generally intends to limit distributions from non-U.S. subsidiaries to earnings previously taxed in the U.S. The company has accrued approximately $
The following disclosure related to the undistributed earnings in non-U.S. subsidiaries is in accordance with guidance prior to the adoption of the new tax disclosures. As of December 31, 2024, the company has $
Several of Ball’s Brazilian subsidiaries benefit from various tax holidays with expiration dates ranging from 2026 to 2033. The company regularly applies for and has historically been granted, similar tax holidays upon expiration. These tax holidays reduced income tax by $
The following table of income taxes paid, net of refunds received, for the year ended December 31, 2025, is in accordance with the guidance of the new income tax disclosures:
Year Ended December 31, | |||
($ in millions) | | 2025 | |
Income taxes paid, net of refunds | |||
Federal | $ | | |
State | ( | ||
Foreign | |||
Brazil | | ||
Chile | | ||
Mexico | | ||
United Kingdom | | ||
All other foreign | | ||
Total | $ | | |
The Federal amount paid in 2025 represents purchases of transferable tax credits.
The following disclosure was prepared in accordance with the guidance prior to the adoption of the new income tax disclosures. Income tax payments, net of refunds received and inclusive of payments related to the historical aerospace business, were $
67
The significant components of deferred tax assets and liabilities are as follows:
December 31, | ||||||
($ in millions) | | 2025 | | 2024 | ||
| ||||||
Deferred tax assets: | ||||||
Deferred compensation | $ | | $ | | ||
Accrued employee benefits | | | ||||
Capitalized research and development | | | ||||
Net operating losses, tax credits and other tax attributes | | | ||||
Deferred interest | | | ||||
Operating lease liabilities | | | ||||
Other | | | ||||
Total deferred tax assets | | | ||||
Valuation allowance | ( | ( | ||||
Net deferred tax assets | | | ||||
Deferred tax liabilities: | ||||||
Property, plant and equipment | ( | ( | ||||
Goodwill and other intangible assets | ( | ( | ||||
Deferred revenue | — | ( | ||||
Operating lease right of use assets | ( | ( | ||||
Tax on undistributed foreign earnings | ( | ( | ||||
Other | ( | ( | ||||
Total deferred tax liabilities | ( | ( | ||||
Net deferred tax asset (liability) | $ | ( | $ | ( | ||
The net deferred tax asset (liability) was included on the consolidated balance sheets as follows:
December 31, | ||||||
($ in millions) | | 2025 | | 2024 | ||
Other assets | $ | | $ | | ||
Deferred taxes | ( | ( | ||||
Net deferred tax asset (liability) | $ | ( | $ | ( | ||
68
At December 31, 2025, Ball has recorded deferred tax assets related to net operating and capital loss carryforwards of $
Ball’s 2025 effective tax rate was impacted by $
In 2024, the company’s overall valuation allowances decreased by a net $
In 2023, the company’s overall valuation allowances increased by a net $
A roll forward of the company’s unrecognized tax benefits, as included in other noncurrent liabilities, related to uncertain income tax positions at December 31 follows:
($ in millions) | | 2025 | | 2024 | | 2023 | |||
Balance at January 1 | $ | | $ | | $ | | |||
Additions for tax positions of prior years | | — | | ||||||
Reductions for settlements | — | — | ( | ||||||
Reductions due to lapse of statute of limitations | — | ( | — | ||||||
Effect of currency exchange rates | | — | — | ||||||
Balance at December 31 | $ | | $ | | $ | | |||
At December 31, 2025, the amounts of unrecognized tax benefits that, if recognized, would reduce tax expense were $
69
17. Employee Benefit Obligations
December 31, | ||||||
($ in millions) | 2025 | | 2024 | |||
Underfunded defined benefit pension liabilities | $ | | $ | | ||
Less: Current portion | ( | ( | ||||
Long-term defined benefit pension liabilities | | | ||||
Long-term retiree medical liabilities | | | ||||
Deferred compensation plans | | | ||||
Other | | | ||||
$ | | $ | | |||
The company’s defined benefit plans for salaried and hourly employees in North America, Sweden, Switzerland, the U.K., Germany and Ireland, provide pension benefits based on employee compensation and years of service. Plans for North American hourly employees provide benefits based on fixed rates for each year of service. While the German, Swedish and certain U.S. plans are not funded, the company maintains liabilities, and annual additions to such liabilities are generally tax-deductible. With the exception of the unfunded German, Swedish and certain U.S. plans, the company’s policy is to fund the defined benefit plans in amounts at least sufficient to satisfy statutory funding requirements, taking into consideration deductibility under existing tax laws and regulations. The company closed its pension plans to all non-unionized new entrants in the United States effective for anyone hired after December 31, 2021. Anyone employed by Ball prior to that date is unaffected by this change.
Defined Benefit Pension Plans
Amounts recognized on the consolidated balance sheets for the funded status of the company’s defined benefit pension plans consisted of:
Year Ended December 31, | ||||||||||||||||||
2025 | 2024 | |||||||||||||||||
($ in millions) | | U.S. | | Non-U.S. | | Total | | U.S. | | Non-U.S. | | Total | ||||||
Long-term pension asset | $ | | $ | | $ | | $ | — | $ | | $ | | ||||||
Defined benefit pension liabilities (a) | ( | ( | ( | ( | ( | ( | ||||||||||||
Funded status | $ | ( | $ | ( | $ | ( | $ | ( | $ | ( | $ | ( | ||||||
| (a) | Included is an unfunded, non-qualified U.S. plan obligation of $ |
70
An analysis of the change in benefit accounts for 2025 and 2024 follows:
December 31, | ||||||||||||||||||
2025 | 2024 | |||||||||||||||||
($ in millions) | | U.S. | | Non-U.S. | | Total | | U.S. | | Non-U.S. | | Total | ||||||
Change in projected benefit obligation: | ||||||||||||||||||
Benefit obligation at prior year end | $ | | $ | | $ | | $ | | $ | | $ | | ||||||
Service cost | | — | | | | | ||||||||||||
Interest cost | | | | | | | ||||||||||||
Benefits paid | ( | ( | ( | ( | ( | ( | ||||||||||||
Net actuarial (gains) losses | | ( | ( | ( | ( | ( | ||||||||||||
Settlements and other | — | — | — | — | — | — | ||||||||||||
Other | ( | — | ( | — | ( | ( | ||||||||||||
Effect of exchange rates | — | | | — | ( | ( | ||||||||||||
Benefit obligation at year end | | | | | | | ||||||||||||
Change in plan assets: | ||||||||||||||||||
Fair value of assets at prior year end | | | | | | | ||||||||||||
Actual return on plan assets | | | | | ( | ( | ||||||||||||
Employer contributions | | | | | | | ||||||||||||
Benefits paid | ( | ( | ( | ( | ( | ( | ||||||||||||
Settlements and other | — | — | — | — | — | — | ||||||||||||
Other | — | — | — | — | | | ||||||||||||
Effect of exchange rates | — | | | — | ( | ( | ||||||||||||
Fair value of assets at end of year | | | | | | | ||||||||||||
Funded status | $ | ( | $ | ( | $ | ( | $ | ( | $ | ( | $ | ( | ||||||
Amounts, inclusive of amounts related to the historical aerospace business, recognized in accumulated other comprehensive earnings (loss), including other postemployment benefits, consisted of:
December 31, | ||||||||||||||||||
2025 | 2024 | |||||||||||||||||
($ in millions) | | U.S. | | Non-U.S. | | Total | | U.S. | | Non-U.S. | | Total | ||||||
Net actuarial (loss) gain | $ | ( | $ | ( | $ | ( | $ | ( | $ | ( | $ | ( | ||||||
Net prior service (cost) credit | | ( | ( | | ( | ( | ||||||||||||
Tax effect and currency exchange rates | | | | | | | ||||||||||||
$ | ( | $ | ( | $ | ( | $ | ( | $ | ( | $ | ( | |||||||
Net actuarial losses at December 31, 2025 and 2024, primarily relate to the 2023 U.K. defined benefit pension plan buy-in and a decrease in global discount rates.
71
The accumulated benefit obligation for all U.S. defined benefit pension plans was $
December 31, | ||||||||||||||||||
2025 | 2024 | |||||||||||||||||
($ in millions) | | U.S. | | Non-U.S. | | Total | | U.S. | | Non-U.S. | | Total | ||||||
Projected benefit obligation | $ | | $ | | $ | | $ | | $ | | $ | | ||||||
Accumulated benefit obligation | | | | | | | ||||||||||||
Fair value of plan assets (a) | | — | | | | | ||||||||||||
| (a) | The German, Swedish and certain U.S. plans are unfunded and, therefore, there is |
Components of net periodic benefit cost were as follows:
Years Ended December 31, | |||||||||||||||||||||||||||
2025 | 2024 |
| 2023 | ||||||||||||||||||||||||
($ in millions) | U.S. | | Non-U.S. | | Total | | U.S. | | Non-U.S. | | Total | U.S. | | Non-U.S. | | Total | |||||||||||
Ball-sponsored plans: | |||||||||||||||||||||||||||
Service cost | $ | | $ | — | $ | | $ | | $ | | $ | | $ | | $ | | $ | | |||||||||
| | | | | | | | | |||||||||||||||||||
( | ( | ( | ( | ( | ( | ( | ( | ( | |||||||||||||||||||
— | | | | | | | | | |||||||||||||||||||
| | | | | | | | | |||||||||||||||||||
— | — | — | — | — | — | | — | | |||||||||||||||||||
Total net periodic benefit cost | $ | ( | $ | | $ | | $ | ( | $ | | $ | | $ | — | $ | ( | $ | ( | |||||||||
Non-service pension expense of $
Contributions to the company’s defined benefit pension plans are expected to be approximately $
Weighted average assumptions used to determine benefit obligations for the company’s significant U.S. plans at December 31 were as follows:
U.S. | |||||||
| 2025 | 2024 | 2023 | | |||
Discount rate | | % | | % | | % | |
Rate of compensation increase | | % | | % | | % | |
72
Weighted average assumptions used to determine benefit obligations for the company’s significant European plans at December 31 were as follows:
U.K. | Germany | ||||||||||||
| 2025 | 2024 | 2023 | | 2025 | 2024 | 2023 |
| |||||
Discount rate | | % | | % | | % | | % | | % | | % | |
Rate of compensation increase | N/A | N/A | | % | | % | | % | | % | |||
Pension increase | | % | | % | | % | | % | | % | | % | |
Weighted average assumptions used to determine net periodic benefit cost for the company’s significant U.S. plans for the years ended December 31 were as follows:
U.S. | |||||||
| 2025 | 2024 | 2023 | | |||
Discount rate | | % | | % | | % | |
Rate of compensation increase | | % | | % | | % | |
Expected long-term rate of return on assets | | % | | % | | % | |
Weighted average assumptions used to determine net periodic benefit cost for the company’s significant European plans for the years ended December 31 were as follows:
U.K. | Germany | ||||||||||||
| 2025 | 2024 | 2023 | | 2025 | 2024 | 2023 |
| |||||
Discount rate | | % | | % | | % | | % | | % | | % | |
Rate of compensation increase | N/A | | % | | % | | % | | % | | % | ||
Pension increase | | % | | % | | % | | % | | % | | % | |
Expected long-term rate of return on assets | | % | | % | | % | N/A | N/A | N/A | ||||
The discount and compensation increase rates used above to determine the December 31, 2025, benefit obligations will be used to determine net periodic benefit cost for 2026. A reduction of the expected return on pension assets assumption by one quarter of a percentage point would result in an approximate $
Accounting for pensions and postretirement benefit plans requires that the benefit obligation be discounted to reflect the time value of money at the measurement date and the rates of return currently available on high-quality, fixed-income securities whose cash flows (via coupons and maturities) match the timing and amount of future benefit plan payments. Other factors used in measuring the obligation include compensation increases, health care cost increases, future rates of inflation, mortality and employee turnover.
Actual results may differ from the company’s actuarial assumptions, which may have an impact on the amount of reported expense or liability for pensions or postretirement benefits. In 2025, the company recorded net periodic benefit cost of $
The assumption related to the expected long-term rate of return on plan assets reflects the average rate of earnings expected on the funds invested to provide for pension benefits over the life of the plans. The assumption was based upon Ball’s pension plan asset allocations, investment strategies and the views of its investment managers, consultants and other large pension plan sponsors. Some reliance was placed on the historical and expected asset returns of the company’s plans. An asset-allocation optimization model was used to project future asset returns using simulation and asset class correlation. The analysis included expected future risk premiums, forward-looking return expectations derived from the yield on long-term bonds and the price earnings ratios of major stock market indexes, expected inflation levels and real risk-free interest rate assumptions and the fund’s expected asset allocation.
73
The expected long-term rates of return on assets were calculated by applying the expected rate of return to a market-related value of plan assets at the beginning of the year, adjusted for the weighted average expected contributions and benefit payments. The market-related value of plan assets used to calculate the expected return on plan assets was $
Defined Benefit Pension Plan Assets
Policies and Allocation Information
Pension investment committees or scheme trustees of the company and its relevant subsidiaries establish investment policies and strategies for the company’s pension plan assets. The investment policies and strategies include the following common themes to: (1) provide for long-term growth of principal without undue exposure to risk, (2) minimize contributions to the plans, (3) minimize and stabilize pension expense and (4) achieve a rate of return equal to or above the market average for each asset class over the long term. The pension investment committees are required to regularly, but no less frequently than annually, review asset mix and asset performance, as well as the performance of the investment managers. Based on their reviews, which are generally conducted quarterly, investment policies and strategies are revised as appropriate.
Target asset allocations are set using a minimum and maximum range for each asset category as a percent of the total funds’ market value. Following are the target asset allocations established as of December 31, 2025:
U.S. | U.K. | ||||
Cash and cash equivalents | — | % | % | ||
Equity securities | % | % | |||
Fixed income securities | % | — | % | ||
Insurance contract | — | % | % | ||
Alternative investments | % | — | % |
The actual weighted average asset allocations for Ball’s defined benefit pension plans, which individually were within the established targets for each country for that year, were as follows at December 31:
| 2025 | | 2024 |
| |
Cash and cash equivalents | | % | | % | |
Equity securities | | % | | % | |
Fixed income securities | | % | | % | |
Insurance contract | | % | | % | |
Alternative investments | | % | | % | |
| % | | % |
Fair Value Measurements of Pension Plan Assets
Following is a description of the valuation methodologies used for pension assets measured at fair value:
Cash and cash equivalents: Consist of cash on deposit with brokers and short-term U.S. Treasury money market funds with a maturity of less than 90 days, and such amounts are shown net of receivables and payables for securities traded at period end but not yet settled. All cash and cash equivalents are stated at cost, which approximates fair value.
Corporate equity securities: Valued at the closing price reported on the active market on which the individual security is traded.
74
U.S. government and agency securities: Valued using the pricing of similar agency issues, live trading feeds from several vendors and benchmark yields.
Corporate bonds and notes: Valued using market inputs including benchmark yields, reported trades, broker/dealer quotes, issuer spreads, benchmark securities, bids, offers and reference data including market research publications. Inputs may be prioritized differently at certain times based on market conditions.
Group annuity insurance contract: Valued based on the calculated pension benefit obligation covered by the non-participating annuity contract at year-end.
Commingled funds: The shares held are valued at their net asset value (NAV) at year end.
NAV practical expedient: Includes certain commingled fixed income and equity funds as well as limited partnership and other funds. Certain of the partnership investments receive fair market valuations on a quarterly basis. Certain other commingled funds and partnerships invest in market-traded securities, both on a long and short basis. These investments are valued using quoted market prices.
The preceding methods described may produce a fair value calculation that is not indicative of net realizable value or reflective of future fair values. Furthermore, although the company believes its valuation methods are appropriate and consistent with other market participants, the use of different methodologies or assumptions to determine the fair value of certain financial instruments could result in a different fair value measurement at the reporting date.
75
The company’s assessment of the significance of a particular input to the fair value measurement requires judgment and may affect the valuation of pension assets and liabilities and their placement within the fair value hierarchy levels. The fair value hierarchy levels assigned to the company’s defined benefit plan assets for the U.S. are summarized in the tables below:
December 31, 2025 | |||||||||
($ in millions) | | Level 1 | | Level 2 | | Total | |||
U.S. pension assets, at fair value: | |||||||||
Cash and cash equivalents | $ | — | $ | | $ | | |||
U.S. government, agency and asset-backed securities: | |||||||||
Municipal bonds | — | | | ||||||
Treasury bonds | | — | | ||||||
Other | — | | | ||||||
Non-U.S. government bonds | — | | | ||||||
Corporate bonds and notes: | |||||||||
Basic materials | — | | | ||||||
Communications | — | | | ||||||
Consumer discretionary | — | | | ||||||
Consumer staples | — | | | ||||||
Energy | — | | | ||||||
Financials | — | | | ||||||
Industrials | — | | | ||||||
Information technology | — | | | ||||||
Private placement | — | | | ||||||
Healthcare | | | |||||||
Utilities | — | | | ||||||
Total level 1 and level 2 | $ | | $ | | | ||||
Other investments measured at net asset value (a) | | ||||||||
Total assets | $ | | |||||||
| (a) | Certain investments measured at fair value using the NAV per share (or its equivalent) practical expedient have not been classified within the fair value hierarchy. The fair value amounts presented in this table are intended to permit reconciliation of the fair value hierarchy to the amounts presented in the change in plan assets reconciliation. |
76
December 31, 2024 | |||||||||
($ in millions) | | Level 1 | | Level 2 | | Total | |||
U.S. pension assets, at fair value: | |||||||||
Cash and cash equivalents | $ | — | $ | | $ | | |||
U.S. government, agency and asset-backed securities: | |||||||||
Municipal bonds | — | | | ||||||
Treasury bonds | | — | | ||||||
Other | — | | | ||||||
Non-U.S. government bonds | — | | | ||||||
Corporate bonds and notes: | |||||||||
Basic materials | — | | | ||||||
Communications | — | | | ||||||
Consumer discretionary | — | | | ||||||
Consumer staples | — | | | ||||||
Energy | — | | | ||||||
Financials | — | | | ||||||
Industrials | — | | | ||||||
Information technology | — | | | ||||||
Private placement | — | | | ||||||
Utilities | — | | | ||||||
Total level 1 and level 2 | $ | | $ | | | ||||
Other investments measured at net asset value (a) | | ||||||||
Total assets | $ | | |||||||
| (a) | Certain investments measured at fair value using the NAV per share (or its equivalent) practical expedient have not been classified within the fair value hierarchy. The fair value amounts presented in this table are intended to permit reconciliation of the fair value hierarchy to the amounts presented in the change in plan assets reconciliation. |
December 31, | ||||||
($ in millions) | 2025 | 2024 | ||||
U.K. pension assets, at fair value: | ||||||
Level 1: Equity and commingled funds | | | ||||
Level 3: Insurance annuity contract | | | ||||
Total assets | $ | | $ | | ||
In November 2023, the Trustee Board of the U.K. defined benefit pension plan entered into an agreement with an insurance company for a bulk annuity purchase, or “buy-in”, for its U.K. defined benefit pension plan to reduce retirement plan risk, while delivering promised benefits to plan participants. This transaction allows the company to reduce volatility by removing investment, longevity, mortality, interest rate and inflation risk upon the transfer of substantially all of the pension plan assets to the insurer in exchange for the group annuity insurance contract. At this time the company retains both the fair value of the annuity contract within plan assets and the pension benefit obligations related to these participants. The fair value of the annuity buy-in contract was $
77
Following is a rollforward of the fair value of plan assets from December 31, 2024 to December 31, 2025:
($ in millions) | |||
Balance as of December 31, 2024 | $ | | |
Change in plan assets | ( | ||
Effect of exchange rates | | ||
Balance as of December 31, 2025 | $ | | |
Other Postretirement Benefits
The company sponsors postretirement health care and life insurance plans for certain U.S. and Canadian employees. Employees may also qualify for long-term disability, medical and life insurance continuation and other postemployment benefits upon termination of active employment prior to retirement. All of the Ball-sponsored postretirement health care and life insurance plans are unfunded with the exception of life insurance benefits, which are self-insured. The benefit obligation associated with these plans was $
Weighted average assumptions used to determine benefit obligations for the other postretirement benefit plans at December 31 were as follows:
U.S. | Canada | ||||||||||||
| 2025 | 2024 | 2023 | | 2025 | 2024 | 2023 | | |||||
Discount rate | | % | | % | | % | | % | | % | | % | |
Rate of compensation increase (a) | N/A | N/A | | % | N/A | N/A | N/A | ||||||
| (a) | The rate of compensation increase is not applicable for certain U.S. other postretirement benefit plans. |
Weighted average assumptions used to determine net periodic benefit cost for the other postretirement benefit plans at December 31 were as follows:
U.S. | Canada | ||||||||||||
| 2025 | 2024 | 2023 | | 2025 | 2024 | 2023 | | |||||
Discount rate | | % | | % | | % | | % | | % | | % | |
Rate of compensation increase (a) | N/A | | % | | % | N/A | N/A | N/A | |||||
| (a) | The rate of compensation increase is not applicable for certain U.S. other postretirement benefit plans. |
Deferred Compensation Plans
Certain management employees may elect to defer the payment of all or a portion of their annual incentive compensation and certain long-term stock-based compensation into the company’s deferred compensation plan and/or the company’s deferred compensation stock plan. The employee becomes a general unsecured creditor of the company with respect to any amounts deferred.
78
18. Shareholders’ Equity
At December 31, 2025, the company had
In the second quarter of 2025, in a privately negotiated transaction, Ball entered into an accelerated share repurchase agreement to buy $
On January 29, 2025, the Board of Directors approved the repurchase by the company of up to a total of $
Under its ongoing share repurchase program, the company repurchased $
Accumulated Other Comprehensive Earnings (Loss)
The activity related to accumulated other comprehensive earnings (loss) was as follows:
($ in millions) | |
| | Pension and | (a) | Derivatives Designated as Hedges | | Accumulated | ||||||
| ||||||||||||||
Balance at December 31, 2023 | $ | ( | $ | ( | $ | | $ | ( | ||||||
Other comprehensive earnings (loss) before reclassifications | ( | | | ( | ||||||||||
Amounts reclassified into earnings | — | | ( | ( | ||||||||||
Aerospace disposal | — | | — | | ||||||||||
Balance at December 31, 2024 | $ | ( | $ | ( | $ | | $ | ( | ||||||
Other comprehensive earnings (loss) before reclassifications | | ( | ( | | ||||||||||
Amounts reclassified into earnings | | (b) | | | | |||||||||
Balance at December 31, 2025 | $ | ( | $ | ( | $ | | $ | ( | ||||||
(a) Includes amounts associated with the Salaried Employees of Ball Aerospace & Technologies Corp. Pension Plan through the date of the aerospace business sale.
(b) Currency translation recorded in business consolidation and other activities from business disposal.
79
The following table provides additional details of the amounts reclassified into net earnings from accumulated other comprehensive earnings (loss):
Years Ended December 31, | ||||||||||
($ in millions) | | 2025 | | 2024 | | 2023 |
| |||
Gains (losses) on cash flow hedges: | ||||||||||
Commodity contracts recorded in net sales | $ | ( | $ | ( | $ | | ||||
Commodity contracts recorded in cost of sales | ( | ( | ( | |||||||
Currency exchange contracts recorded in selling, general and administrative | ( | | | |||||||
Interest rate contracts recorded in interest expense | | | | |||||||
Total before tax effect | ( | | ( | |||||||
Tax benefit (expense) on amounts reclassified into earnings | | ( | | |||||||
Recognized gain (loss), net of tax | $ | ( | $ | | $ | ( | ||||
Amortization and disposal of pension and other postretirement benefits: (a) | ||||||||||
Actuarial gains (losses) | $ | ( | $ | ( | $ | | ||||
Prior service income (expense) | ( | ( | ( | |||||||
Aerospace disposal | — | ( | — | |||||||
Total before tax effect | ( | ( | | |||||||
Tax benefit (expense) on amounts reclassified into earnings | | | — | |||||||
Recognized gain (loss), net of tax | $ | ( | $ | ( | $ | | ||||
| (a) | Includes amounts associated with the Salaried Employees of Ball Aerospace & Technologies Corp. Pension Plan |
19. Stock-Based Compensation Programs
The company has shareholder-approved stock plans under which options and stock-settled appreciation rights (SSARs) have been granted to employees at the market value of the company’s stock on the date of grant. In general, options and SSARs are exercisable in
Number of | Weighted Average | ||||
| Shares | | Exercise Price | ||
Beginning of year | | $ | | ||
Granted | | | |||
Exercised | ( | | |||
Canceled/forfeited | ( | | |||
Expired | ( | | |||
End of period | | | |||
Vested and exercisable, end of year | | $ | | ||
Reserved for future grants | | ||||
80
The weighted average remaining contractual term for all options and SSARs outstanding at December 31, 2025, was
Based on the Black-Scholes option pricing model, options granted in 2025, 2024 and 2023 have estimated weighted average fair values at the date of grant of $
2025 Grants | 2024 Grants | 2023 Grants | |||||
Expected dividend yield | | % | | % | | % | |
Expected stock price volatility | | % | | % | | % | |
Risk-free interest rate | | % | | % | | % | |
Expected life of options (in years) |
In addition to stock options and SSARs, the company issues to certain employees restricted shares and restricted stock units, which generally vest over
Following is a summary of restricted stock activity for the year ended December 31, 2025:
Weighted | |||||
Number of | Average | ||||
| Shares/Units | | Grant Price | ||
Beginning of year | | $ | | ||
Granted | | | |||
Vested | ( | | |||
Canceled/forfeited | ( | | |||
End of year | | $ | | ||
For the years ended December 31, 2025, 2024 and 2023, the company recognized pretax expense of $
81
20. Earnings Per Share
Years Ended December 31, | |||||||||
($ in millions, except per share amounts; shares in thousands) | | 2025 | | 2024 | | 2023 | |||
Earnings from continuing operations attributable to Ball Corporation, net of tax | $ | | $ | | $ | | |||
Discontinued operations, net of tax | — | | | ||||||
Net earnings attributable to Ball Corporation | $ | | $ | | $ | | |||
Basic weighted average common shares | | | | ||||||
Effect of dilutive securities | | | | ||||||
Weighted average shares applicable to diluted earnings per share | | | | ||||||
Basic - continuing operations | $ | | $ | | $ | | |||
Basic - discontinued operations | — | | | ||||||
Per basic share | $ | | $ | | $ | | |||
Diluted - continuing operations | $ | | $ | | $ | | |||
Diluted - discontinued operations | — | | | ||||||
Per diluted share | $ | | $ | | $ | | |||
Certain outstanding options were excluded from the diluted earnings per share calculations because they were anti-dilutive. The excluded options totaled approximately
The company declared and paid dividends of $
21. Financial Instruments and Risk Management
Policies and Procedures
The company employs established risk management policies and procedures, which seek to reduce the company’s commercial risk exposure to fluctuations in commodity prices, interest rates, currency exchange rates, net investments in foreign operations and prices of the company’s common stock with regard to common share repurchases and the company’s deferred compensation stock plan. However, there can be no assurance that these policies and procedures will be successful. Although the instruments utilized involve varying degrees of credit, market and interest risk, the counterparties to the agreements are expected to perform fully under the terms of the agreements. The company monitors counterparty credit risk, including lenders, on a regular basis, but Ball cannot be certain that all risks will be discerned or that its risk management policies and procedures will always be effective. Additionally, in the event of default under the company’s master derivative agreements, the non-defaulting party has the option to set off any amounts owed with regard to open derivative positions.
Commodity Price Risk - The company manages commodity price risk in connection with market price fluctuations of aluminum through
82
Interest Rate Risk - The company’s objective in managing exposure to interest rate changes is to minimize the impact of interest rate changes on earnings and cash flows and to lower its overall borrowing costs. To achieve these objectives, the company may use a variety of interest rate swaps, collars and options to manage its mix of floating and fixed-rate debt.
Currency Exchange Rate Risk - The company’s objective in managing exposure to currency fluctuations is to limit the exposure of cash flows and earnings from changes associated with currency exchange rate changes through the use of various derivative contracts. In addition, at times the company manages earnings translation volatility through the use of currency option strategies, and the change in the fair value of those options is recorded in the company’s net earnings.
Net Investments in Foreign Operations Risk – The company is exposed to changes in foreign currencies impacting its net investments held in foreign subsidiaries. The company’s objective in managing exposure to net investments in foreign operations is to limit the foreign exchange translation risk associated with its net investments in non-U.S. Dollar foreign entities. The company uses fixed-for-fixed cross currency swaps and debt to achieve this objective.
The following table provides additional information related to the commercial risk management derivative instruments described above:
($ in millions) | December 31, 2025 | |||||||||||
Commercial risk area | Commodity | Currency | | Interest Rate | | Net Investment | ||||||
Notional amount of contracts | $ | | $ | | $ | | € | | ||||
Net gain (loss) included in AOCI, after-tax | | | — | $ | ( | |||||||
Net gain (loss) included in AOCI, after-tax, expected to be recognized in net earnings within the next 12 months | | | — | — | ||||||||
Longest duration of forecasted hedge transactions in years | ||||||||||||
In May 2025, Ball issued €
Common Stock Price Risk
The company’s deferred compensation stock program is subject to variable plan accounting and, accordingly, is marked to fair value using the company’s closing stock price at the end of the related reporting period. The company entered into total return swaps to reduce the company’s earnings exposure to these fair value fluctuations that will be outstanding through March 2026, and which have a combined notional value of
Fair Value Measurements
Ball has classified all applicable financial derivative assets and liabilities as Level 2 within the fair value hierarchy as of December 31, 2025 and 2024, and presented those values in the tables below. The company’s assessment of the significance of a particular input to the fair value measurement requires judgment and may affect the valuation of fair value assets and liabilities and their placement within the fair value hierarchy levels.
83
December 31, 2025 | ||||||||||
($ in millions) | Balance Sheet Location | | Derivatives | | Derivatives not | | Total | |||
Assets: | ||||||||||
$ | | $ | — | $ | | |||||
Currency contracts | — | | | |||||||
| | | ||||||||
Other current assets | $ | | $ | | $ | | ||||
$ | | $ | — | $ | | |||||
Currency contracts | — | — | — | |||||||
Other noncurrent assets | $ | | $ | — | $ | | ||||
| ||||||||||
Liabilities: | ||||||||||
$ | | $ | | $ | | |||||
| | | ||||||||
Other current liabilities | $ | | $ | | $ | | ||||
| — | | ||||||||
| — | | ||||||||
Other noncurrent liabilities | $ | | $ | — | $ | | ||||
84
December 31, 2024 | ||||||||||
($ in millions) | Balance Sheet Location | Derivatives | | Derivatives not | | Total | ||||
Assets: | ||||||||||
$ | | $ | — | $ | | |||||
— | | | ||||||||
| — | | ||||||||
Other current assets | $ | | $ | | $ | | ||||
$ | | $ | — | $ | | |||||
| — | | ||||||||
| — | | ||||||||
Other noncurrent assets | $ | | $ | — | $ | | ||||
| ||||||||||
Liabilities: | ||||||||||
$ | | $ | — | $ | | |||||
— | | | ||||||||
Other current liabilities | $ | | $ | | $ | | ||||
$ | | $ | — | $ | | |||||
— | | | ||||||||
Other noncurrent liabilities | $ | | $ | | $ | | ||||
The company uses closing spot and forward market prices as published by the London Metal Exchange, the Chicago Mercantile Exchange, Reuters and Bloomberg to determine the fair value of any outstanding aluminum, currency, energy, cross currency swaps and interest rate spot and forward contracts. Option contracts are valued using a Black-Scholes model with observable market inputs for aluminum, currency and interest rates. The company values each of its financial instruments either internally using a single valuation technique, from a reliable observable market source or from third-party software. The present value discounting factor is based on the comparable time period Secured Overnight Financing Rate (SOFR). Ball performs validations of the company’s internally derived fair values reported for the company’s financial instruments on a quarterly basis utilizing counterparty valuation statements. The company additionally evaluates counterparty creditworthiness and, as of December 31, 2025, has not identified any circumstances requiring the reported values of the company’s financial instruments be adjusted.
85
The following tables provide the effects of derivative instruments in the consolidated statements of earnings:
Year Ended December 31, 2025 | |||||||||
($ in millions) | | Location of Gain (Loss) Recognized in Earnings on Derivatives | | Cash Flow | | Gain (Loss) on | |||
Commodity contracts - manage exposure to customer pricing | Net sales | $ | ( | $ | — | ||||
Commodity contracts - manage exposure to supplier pricing | Cost of sales | ( | ( | ||||||
Interest rate contracts - manage exposure for outstanding debt | | — | |||||||
Currency contracts - manage currency exposure | ( | ( | |||||||
Equity contracts | Selling, general and administrative | — | ( | ||||||
Total | $ | ( | $ | ( | |||||
Year Ended December 31, 2024 | |||||||||
($ in millions) | | Location of Gain (Loss) | Cash Flow | | Gain (Loss) on | ||||
Commodity contracts - manage exposure to customer pricing | Net sales | $ | ( | $ | — | ||||
Commodity contracts - manage exposure to supplier pricing | Cost of sales | ( | ( | ||||||
Interest rate contracts - manage exposure for outstanding debt | | — | |||||||
Currency contracts - manage currency exposure | | | |||||||
Equity contracts | Selling, general and administrative | — | ( | ||||||
Total | $ | | $ | | |||||
86
Year Ended December 31, 2023 | |||||||||
($ in millions) | | Location of Gain (Loss) | Cash Flow | | Gain (Loss) on | ||||
Commodity contracts - manage exposure to customer pricing | Net sales | $ | | $ | — | ||||
Commodity contracts - manage exposure to supplier pricing | Cost of sales | ( | | ||||||
Interest rate contracts - manage exposure for outstanding debt | | ( | |||||||
Currency contracts - manage currency exposure | | ( | |||||||
Equity contracts | Selling, general and administrative | — | | ||||||
Total | $ | ( | $ | | |||||
The changes in accumulated other comprehensive earnings (loss) for derivatives designated as hedges were as follows:
Years Ended December 31, | |||||||||
($ in millions) | | 2025 | | 2024 | | 2023 | |||
Amounts reclassified into earnings: | |||||||||
Commodity contracts | $ | | $ | | $ | | |||
Interest rate contracts | ( | ( | ( | ||||||
Currency exchange contracts | | ( | ( | ||||||
Change in fair value of hedges: | |||||||||
Commodity contracts | ( | | ( | ||||||
Interest rate contracts | ( | | | ||||||
Currency exchange contracts | ( | | — | ||||||
Net investment hedge | ( | | — | ||||||
Currency and tax impacts | ( | ( | ( | ||||||
$ | ( | $ | | $ | | ||||
87
22. Contingencies
Ball is subject to numerous lawsuits, claims or proceedings arising out of the ordinary course of business, including actions related to product liability; personal injury; the use and performance of company products; warranty matters; patent, trademark or other intellectual property infringement; contractual liability; the conduct of the company’s business; tax reporting in domestic and non-U.S. jurisdictions; workplace safety and environmental and other matters. The company has also been identified as a potentially responsible party (PRP) at several waste disposal sites under U.S. federal and related state environmental statutes and regulations and may have joint and several liability for any investigation and remediation costs incurred with respect to such sites. In addition, the company has received claims alleging that employees in certain plants have suffered damages due to exposure to alleged workplace hazards. Some of these lawsuits, claims and proceedings involve substantial amounts, including as described below, and some of the environmental proceedings involve potential monetary costs or sanctions that may be material. Ball has denied liability with respect to many of these lawsuits, claims and proceedings and is vigorously defending such lawsuits, claims and proceedings. The company carries various forms of commercial, property and casualty, and other forms of insurance; however, such insurance may not be applicable or adequate to cover the costs associated with a judgment against Ball with respect to these lawsuits, claims and proceedings. The company estimates that potential for all currently known and estimable environmental matters are approximately $
In September 2025, the company received notice from the U.S. Customs and Border Protection challenging the tariff classification and applicable rate of duty of certain aluminum imports asserting that additional duties and tariffs are payable, as well as our use of certain exemptions. The company intends to vigorously defend the matter. While the outcome of this matter is uncertain at this time, the company believes it is reasonably possible any such additional tariffs, interest and penalties could be owed and impact the company’s results of operations. The company is unable to develop a reasonable estimate of loss at this time. The company has not recorded a reserve.
On February 1, 2012, Ball Metal Beverage Container Corp. (“BMBCC”) filed suit against Crown Technology Holding, Inc. (“Crown”) in the United States District Court for the Southern District of Ohio seeking a declaratory judgment that the CDL beverage can end made and sold by BMBCC did not infringe certain U.S. patents held by Crown. In response, Crown filed a counterclaim alleging that the CDL ends made and sold by BMBCC infringed the subject patents and seeking damages. On September 25, 2019, the District Court granted BMBCC’s motion for summary judgment holding that the patents at issue were invalid due to indefiniteness. On October 20, 2019, Crown appealed this decision to the Court of Appeals for the Federal Circuit (“CAFC”). On December 31, 2020, the CAFC in a non-precedential decision, vacated the decision of the District Court finding that the District Court had not considered an additional factor under a novel position advanced by the CAFC, and remanded the case to the District Court for further proceedings. On August 2, 2023, the District Court again granted summary judgment to Ball finding that patent claims at issue are invalid due to invalidity under the revised analytical framework specified by the CAFC. On August 4, 2023, Crown appealed this decision to the CAFC. On June 30, 2025, the CAFC affirmed the decision of the District Court. Crown has neither sought reconsideration of the CAFC’s decision nor filed writ of certiorari for review by the Supreme Court, therefore, this matter is now considered closed.
The company’s operations in Brazil are involved in various governmental assessments, which have historically mainly related to claims for taxes on the internal transfer of inventory, gross revenue taxes, and indirect tax incentives and deductibility of goodwill. In addition, one of the company’s Brazilian subsidiaries received an income tax assessment focused on the disallowance of deductions associated with the acquisition price paid to a third party for a portion of its operations. Based on the information available at the present time, the company is unable to predict the ultimate outcome of these claims including the amount of reasonably possible loss and intends to vigorously defend these matters.
88
23. Indemnifications and Guarantees
General Guarantees
The company or its appropriate consolidated direct or indirect subsidiaries have made certain indemnities, commitments and guarantees under which the specified entity may be required to make payments in relation to certain transactions. These indemnities, commitments and guarantees are in contracts to which the company or its subsidiaries are a party, including agreements with customers of the subsidiaries in connection with the sales of their packaging products and services; guarantees to suppliers of subsidiaries of the company guaranteeing the performance of the respective entity under a purchase agreement, construction contract, renewable energy purchase contract or other commitment; guarantees in respect of certain non-U.S. subsidiaries’ pension plans; indemnities for liabilities associated with the infringement of third-party patents, trademarks or copyrights under various types of agreements; indemnities to various lessors in connection with facility, equipment, furniture and other personal property leases for certain claims arising from such leases; indemnities pursuant to agreements relating to certain joint ventures; indemnities in connection with the sale of businesses or substantially all of the assets and specified liabilities of businesses; and indemnities to directors, officers and employees of the company to the extent permitted under the laws of the State of Indiana and the United States of America. The duration of these indemnities, commitments and guarantees varies and, in certain cases, is indefinite.
In addition, many of these indemnities, commitments and guarantees do not provide for any limitation on the maximum potential future payments the company could be obligated to make. As such, the company is unable to reasonably estimate its potential exposure under these items.
The company has not recorded any material liabilities for these indemnities, commitments and guarantees in the accompanying consolidated balance sheets. The company does, however, accrue for payments under promissory notes and other evidences of incurred indebtedness and for losses for any known contingent liability, including those that may arise from indemnifications, commitments and guarantees, when future payment is both reasonably estimable and probable. Finally, the company carries specific and general liability insurance policies and has obtained indemnities, commitments and guarantees from third-party purchasers, sellers and other contracting parties, which the company believes would, in certain circumstances, provide recourse to certain claims arising from these indemnifications, commitments and guarantees.
89
Debt Guarantees
The company’s and its subsidiaries’ obligations under the senior notes and senior credit facilities (or, in the case of U.S. domiciled non-U.S. subsidiaries under the senior credit facilities, the obligations of non-U.S. credit parties only) are guaranteed on a full, unconditional and joint and several basis by certain of the company’s domestic subsidiaries and the domestic subsidiary borrowers, and obligations of other guarantors and the subsidiary borrowers under the senior credit facilities are guaranteed by the company, in each case with certain exceptions. These guarantees are required in support of the senior notes and senior credit facilities referred to above, are coterminous with the terms of the respective note indentures, senior notes and credit agreement, and they could be enforced by the holders of the obligations thereunder during the continuation of an event of default under the note indentures, the senior notes and/or the credit agreement. The maximum potential amounts which could be required to be paid under such guarantees are essentially equal to then-outstanding obligations under the respective senior notes or the credit agreement (or, in the case of U.S. domiciled non-U.S. subsidiaries under the senior credit facilities, the obligations of non-U.S. credit parties only), with certain exceptions. All obligations under the guarantees of the senior credit facilities are secured, with certain exceptions, by a valid first priority perfected lien or pledge on (i)
90
Item 9.Changes in and Disagreements with Accountants on Accounting and Financial Disclosure
There were no matters required to be reported under this item.
Item 9A. | Controls and Procedures |
Evaluation of Disclosure Controls and Procedures
Ball Corporation has established disclosure controls and procedures to ensure that information required to be disclosed by us in the reports that the company files or submits under the Securities Exchange Act of 1934, as amended, is recorded, processed, summarized and reported, within the time periods specified in the Commission's rules and forms, and that such information is accumulated and communicated to management of the company, including its Chief Executive Officer and Chief Financial Officer, as appropriate to allow timely decisions regarding required disclosure. As of December 31, 2025, Ball Corporation, under the supervision of the Chief Executive Officer and Chief Financial Officer of the company, has conducted an evaluation of the effectiveness of the design and operation of the company’s disclosure controls and procedures (as defined in Rules 13a-15(e) and 15d-15(e) under the Securities Exchange Act of 1934, as amended) and the Chief Executive Officer and Chief Financial Officer have concluded that the company’s disclosure controls and procedures were effective.
Management’s Report on Internal Control Over Financial Reporting
Management of Ball Corporation is responsible for establishing and maintaining adequate internal control over financial reporting, as such term is defined in Exchange Act Rules 13a-15(f) and 15d-15(f). Under the supervision and with the participation of our management, including our Chief Executive Officer and Chief Financial Officer, the company conducted an evaluation of the effectiveness of our internal control over financial reporting based on the framework described in “Internal Control — Integrated Framework” (2013) issued by the Committee of Sponsoring Organizations of the Treadway Commission. Based on this evaluation, our management concluded that our internal control over financial reporting was effective as of December 31, 2025.
The effectiveness of our internal control over financial reporting as of December 31, 2025, has been audited by PricewaterhouseCoopers LLP, an independent registered public accounting firm, as stated in their report, which is included herein.
Changes in Internal Control over Financial Reporting
There were no changes in our internal control over financial reporting that occurred during the quarter ended December 31, 2025, that have materially affected, or are reasonably likely to materially affect, our internal control over financial reporting.
Item 9B. Other Information
Rule 10b5-1 Trading Plan
During the three months ended December 31, 2025, none of the company’s directors or Section 16 officers
Item 9C. Disclosure Regarding Foreign Jurisdictions that Prevent Inspections
There were no matters required to be reported under this item.
91
Part III
Item 10. Directors, Executive Officers and Corporate Governance.
Insider Trading Policy
The company has
Executive Officers
The executive officers of the company as of February 19, 2026, were as follows:
Nate C. Carey, 47, Vice President and Global Head of Controllership since June 2024; Vice President and Controller from 2017 to 2024; Assistant Controller from 2014 to November 2017.
Carey S. Causey, 48, Senior Vice President and Chief Growth Officer since January 2024; President, Beverage Packaging EMEA from 2021 to 2024; Vice President, Integrated Business Planning from 2020 to 2021; various other positions within the company, 2014 to 2020.
Ted Doering, 54, Senior Vice President and Chief Information Officer since July 2025; Executive Vice President and Chief Information Officer Berry Global, Inc. from August 2024 to June 2025; Chief Digital Officer, Emerson Electric Co. from 2022 to 2024; Group Chief Information Officer, Emerson Electric Co. from 2019 to 2022.
Mandy Glew, 54, Senior Vice President and President, EMEA since April 2024; Vice President, Commercial, Beverage Packaging EMEA from 2020 to 2024.
Deron J. Goodwin, 60, Vice President and Global Head of Treasury since June 2024; Vice President and Treasurer from 2022 to 2024; Assistant Treasurer from 2016 to September 2022.
Ronald J. Lewis, 59, Chief Executive Officer since November 2025, Senior Vice President, Chief Supply Chain and Operations Officer from 2024 to 2025; Senior Vice President, Ball Corporation, and Chief Operating Officer, Global Beverage Packaging, from 2021 to 2024; President, Beverage Packaging EMEA from 2019 to 2021; Chief Supply Chain Officer, Coca-Cola European Partners plc, 2016 to 2019.
Hannah Lim-Johnson, 54, Senior Vice President, Chief Legal Officer and Corporate Secretary since September 2023; Senior Vice President, Chief Legal Officer and Corporate Secretary, Meritor, Inc., 2020 to 2021.
Kathleen E. Pitre, 49, Senior Vice President and President, North and Central America since January 2024; President, Beverage Packaging North and Central America from 2021 to 2024; Chief Commercial and Sustainability Officer, Global Beverage Packaging from 2019 to 2021; various other positions within the company, 2004 to 2019.
Daniel J. Rabbitt, 57, Senior Vice President and Chief Financial Officer since May 2025; Senior Vice President of Corporate Planning and Development from 2024 to 2025, Vice President of Corporate Planning and Development from 2016 to 2024; various other positions within the company, 2004 to 2016.
Scott Vail, 48, Senior Vice President, Chief Supply Chain Officer since December 2025; Chief Operations Officer, Reynolds Consumer Products from September 2025 to December 2025; Vice President, Global Head of Operational Excellence, Ball Corporation from 2024 to September 2025; Vice President of Operations for Beverage Packaging North and Central America, Ball Corporation from 2021 to 2025; President of Metal Container Corporation from 2019 to 2021.
92
Fauze C. Villatoro, 49, Senior Vice President and President, South America since January 2024; President, Beverage Packaging South America from 2022 to 2024; Vice President, Commercial, Beverage Packaging South America from 2020 to 2022; various other positions within the company, 2016 to 2020.
Other information required by Item 10 appearing under the captions “Director Nominees”, “Policies on Business Ethics and Conduct”, “Board Committees” and “Stock Ownership Information,” of the company’s proxy statement to be filed pursuant to Regulation 14A within 120 days after December 31, 2025, is incorporated herein by reference.
Item 11. Executive Compensation
The information required by Item 11 appearing under the captions “Director Independence” and “Executive Compensation,” in the company’s proxy statement, to be filed pursuant to Regulation 14A within 120 days after December 31, 2025, is incorporated herein by reference.
Item 12. Security Ownership of Certain Beneficial Owners and Management and Related Stockholder Matters
The information required by Item 12 appearing under the caption “Stock Ownership Information,” in the company’s proxy statement, to be filed pursuant to Regulation 14A within 120 days after December 31, 2025, is incorporated herein by reference.
Securities authorized for issuance under equity compensation plans are summarized below:
Equity Compensation Plan Information | |||||||
Number of | |||||||
Securities | |||||||
Number of | Remaining Available | ||||||
Securities to be | for Future Issuance | ||||||
Issued Upon | Weighted-Average | Under Equity | |||||
Exercise of | Exercise Price of | Compensation Plans | |||||
| Outstanding Options, | Outstanding Options, | (Excluding Securities | ||||
Warrants and Rights | Warrants and Rights | Reflected in Column (A)) | |||||
Plan Category | | (A) | | (B) | | (C) | |
Equity compensation plans approved by security holders | 7,172,198 | $ | 58.37 | 9,551,038 | |||
Equity compensation plans not approved by security holders | — | — | — | ||||
Total | 7,172,198 | $ | 58.37 | 9,551,038 | |||
Item 13. Certain Relationships and Related Transactions, and Director Independence
The information required by Item 13 appearing under the caption “Transactions with Related Persons, Promoters and Certain Control Persons,” and “Director Independence” in the company’s proxy statement to be filed pursuant to Regulation 14A within 120 days after December 31, 2025, is incorporated herein by reference.
Item 14. Principal Accountant Fees and Services
The information required by Item 14 appearing under the caption “Ratification of the Appointment of Independent Auditor,” in the company’s proxy statement to be filed pursuant to Regulation 14A within 120 days after December 31, 2025, is incorporated herein by reference.
93
Part IV.
Item 15. Exhibits and Financial Statement Schedules
(a) (1) Financial Statements:
The following documents are included in Part II, Item 8:
Report of independent registered public accounting firm
Consolidated statements of earnings — Years ended December 31, 2025, 2024 and 2023
Consolidated balance sheets — December 31, 2025 and 2024
Consolidated statements of cash flows — Years ended December 31, 2025, 2024 and 2023
Consolidated statements of shareholders’ equity — Years ended December 31, 2025, 2024 and 2023
Notes to consolidated financial statements
(2) Financial Statement Schedules:
Financial statement schedules have been omitted, as they are either not applicable, are considered insignificant or the required information is included in the consolidated financial statements or notes thereto.
(3) Exhibits:
Exhibit | Description of Exhibit | |
|---|---|---|
2.1 | ||
3.i | ||
3.ii | ||
4.1(a) | ||
4.1(b) | ||
94
Exhibit | Description of Exhibit | |
|---|---|---|
4.1(c) | ||
4.1(d) | ||
4.1(e) | ||
4.1(f) | ||
4.1(g) | ||
4.1(h) | ||
4.1(i) | ||
4.1(j) | ||
4.1(k) | ||
4.2 | ||
10.1 | ||
10.2 | ||
95
Exhibit | Description of Exhibit | |
|---|---|---|
10.3 | ||
10.4 | ||
10.5 | ||
10.6 | Ball Corporation 1986 Deferred Compensation Plan for Directors, as amended October 27, 1987 (filed by incorporation by reference to the Annual Report on Form 10-K for the year ended December 31, 1990) filed April 1, 1991. | |
10.7 | ||
10.8 | ||
10.9 | Ball Corporation 2005 Deferred Compensation Plan, effective January 1, 2005 (filed by incorporation by reference to Exhibit 10.1 of the Current Report on Form 8-K dated December 23, 2005) filed December 23, 2005, and as amended and restated on January 1, 2013 (filed by incorporation by reference to Exhibit 10.10 of the Annual Report on Form 10-K for the year ended December 31, 2013), filed February 24, 2014. | |
10.10 | Ball Corporation 2005 Deferred Compensation Company Stock Plan, effective January 1, 2005 (filed by incorporation by reference to Exhibit 10.2 of the Current Report on Form 8-K dated December 23, 2005) filed December 23, 2005, and as amended and restated on January 1, 2013 (filed by incorporation by reference to Exhibit 10.11 of the Annual Report on Form 10-K for the year ended December 31, 2013) , filed February 24, 2014. | |
10.11 | Ball Corporation 2005 Deferred Compensation Plan for Directors, effective January 1, 2005 (filed by incorporation by reference to Exhibit 10.3 of the Current Report on Form 8-K dated December 23, 2005) filed December 23, 2005, and as amended and restated on January 1, 2013 (filed by incorporation by reference to Exhibit 10.12 of the Annual Report on Form 10-K for the year ended December 31, 2013), filed February 24, 2014. | |
10.12 | ||
10.13 |
96
Exhibit | Description of Exhibit | |
|---|---|---|
10.14 | ||
10.15 | ||
10.16 | ||
10.17 | ||
10.18 | ||
10.19 | ||
10.20 | ||
10.21 | ||
19 | ||
21 | ||
22 | Obligor group subsidiaries of Ball Corporation. (Filed herewith.) | |
23 | Consent of Independent Registered Public Accounting Firm. (Filed herewith.) | |
24 |
97
Exhibit | Description of Exhibit | |
|---|---|---|
31.1 | ||
31.2 | ||
32.1 | ||
32.2 | ||
97 | ||
101.INS | Extensible Business Reporting Language (XBRL) Instance Document - the instance document does not appear in the Interactive Data File because its XBRL tags are embedded within the Inline XBRL document. | |
101.SCH | Inline XBRL Taxonomy Extension Schema Document. | |
101.CAL | Inline XBRL Taxonomy Extension Calculation Linkbase Document. | |
101.DEF | Inline XBRL Taxonomy Extension Definitions Linkbase Document. | |
101.LAB | Inline XBRL Taxonomy Extension Label Linkbase Document. | |
101.PRE | Inline XBRL Taxonomy Extension Presentation Linkbase Document. | |
104 | The following financial information from Ball Corporation’s Annual Report on Form 10-K for the year ended December 31, 2025, formatted in Inline XBRL (contained in Exhibit 101): (i) the Consolidated Statements of Earnings, (ii) the Consolidated Statements of Comprehensive Earnings, (iii) the Consolidated Balance Sheets, (iv) the Consolidated Statements of Cash Flows, (v) the Consolidated Statements of Shareholders’ Equity and Comprehensive Earnings and (vi) Notes to the Consolidated Financial Statements. (Filed herewith.) |
Item 16. Form 10-K Summary
Not applicable.
98
SIGNATURES
Pursuant to the requirements of Section 13 or 15(d) of the Securities Exchange Act of 1934, the registrant has duly caused this report to be signed on its behalf by the undersigned, thereunto duly authorized.
BALL CORPORATION | ||
(Registrant) | ||
By: | /s/ Ronald J. Lewis | |
Ronald J. Lewis | ||
Chief Executive Officer | ||
February 19, 2026 | ||
Pursuant to the requirements of the Securities Exchange Act of 1934, this report has been signed below by the following persons on behalf of the registrant and in the capacities and on the dates indicated. Each of the directors and officers of the registrant whose signature appears below hereby appoints Ronald J. Lewis, Daniel J. Rabbitt and Nate C. Carey, and each of them severally, as his or her attorney-in-fact to sign in his or her name and behalf, in any and all capacities stated below, and to file with the Securities and Exchange Commission any and all amendments to this report, making such changes in this report as appropriate, and generally to do all such things on their behalf in their capacities as directors and/or officers to enable the registrant to comply with the provisions of the Securities Exchange Act of 1934, and all requirements of the Securities and Exchange Commission.
(1) | Principal Executive Officer: | |||
/s/ Ronald J. Lewis | Chief Executive Officer | |||
Ronald J. Lewis | February 19, 2026 | |||
(2) | Principal Financial Officer: | |||
/s/ Daniel J. Rabbitt | Senior Vice President and Chief Financial Officer | |||
Daniel J. Rabbitt | February 19, 2026 | |||
(3) | Principal Accounting Officer: | |||
/s/ Nate C. Carey | Vice President, Global Head of Controllership | |||
Nate C. Carey | February 19, 2026 | |||
(4) | A Majority of the Board of Directors: | |||
/s/ John A. Bryant | Director | |||
John A. Bryant | February 19, 2026 | |||
/s/ Michael J. Cave | Director | |||
Michael J. Cave | February 19, 2026 | |||
/s/ Aaron M. Erter | Director | |||
Aaron M. Erter | February 19, 2026 | |||
/s/ Dune E. Ives | Director | |||
Dune E. Ives | February 19, 2026 | |||
/s/ Ronald J. Lewis | Director | |||
Ronald J. Lewis | February 19, 2026 |
/s/ Cynthia A. Niekamp | Director | |||
Cynthia A. Niekamp | February 19, 2026 | |||
99
/s/ John E. Panichella | Director | |||
John E. Panichella | February 19, 2026 | |||
/s/ Todd A. Penegor | Director | |||
Todd A. Penegor | February 19, 2026 | |||
/s/ Cathy D. Ross | Director | |||
Cathy D. Ross | February 19, 2026 | |||
/s/ Betty J. Sapp | Director | |||
Betty J. Sapp | February 19, 2026 | |||
/s/ Stuart A. Taylor II | Chairman of the Board of Directors | |||
Stuart A. Taylor II | February 19, 2026 |
100